

Introduction
The life expectancy of women is increasing, but the average age of women at the time of menopause is about 50 years. According to the 2012 World Health Organization's annual report, global life expectancy at birth in 2012 was 68.1 years, Japanese women was 87 years which is the first rank, Spanish women was 68.1 (the second rank), and the Korean women was 84.6 years (the eighth rank) [1]. As women gets older, the prevalence of complications such as osteoporosis and bone fractures increase, and these could be considerable public health problem which cause a lot of social cost [2]. Postmenopausal osteoporosis occurs very commonly because of age related bone loss [3]. In previous studies, estrogen depletion are resulted from an imbalance in bone modeling and this can lead to an accelerated phase of bone loss and an efflux of bone-derived calcium to the extracellular fluids [4]. The increased fragility of bone due to changes in metabolism has also been investigated in experimental studies in rats and women [5,6]. These conditions are closely associated with osteoporosis and fractures that require major surgery. These complications can also cause women to be restricted to bed rest which consequently reduces their quality of life after menopause.
The daily calcium intake and vitamin D are widely considered as the most important supplementations for preventing osteoporosis in postmenopausal women [7]. As women age, the efficiency of calcium absorption through the intestine is also decreased, and women are known to lose approximately 200 mg of calcium per day in the first 3 to 4 years of menopause [8]. Insufficient calcium intake and reduced calcium absorption can result in secondary hyperparathyroidism, which can augment bone resorption. Vitamin D, which is activated in the form of 1,25-dihydroxyvitamin D, facilitates intestinal calcium absorption. Not only that, but when it is deficient, it impairs bone mineralization, as well as muscle strength and balance, which may consequently increase the risk of falling [9]. Previous meta-analyses of randomized controlled studies have proved that postmenopausal women who took sufficient calcium and vitamin D had a decreased risk of fracture [10]. However, there is still a lack of studies on the combined effects of calcium and vitamin D to bone mineral density (BMD) and osteoporosis in Korean postmenopausal women. Therefore, it is very crucial to evaluate the risk of osteoporosis and advise postmenopausal women to take calcium or vitamin D to improve their quality of life.
Therefore, the present study aimed to assess the combined effects of one's daily calcium intake and vitamin D level on the BMD and prevalence of osteopenia and osteoporosis in Korean postmenopausal women aged 45 to 70 years.
Materials and methods
1. Participants
This study was developed from the Korean National Health and Nutrition Examination Survey (KNHANES) IV (data from 2008 and 2009) and KNHANES V (data from 2010 and 2011). These surveys were performed annually by the Korean Ministry of Health and Welfare with approval from the institutional review board of the Korea Centers for Disease Control and Prevention. Using rolling survey sampling, subjects participated in a complex, stratified, probability cluster survey of a representative sample in South Korea. About 4,000 households were involved in 2008 and 2009, and about 3,840 households were involved in 2010 and 2011 from January through December of the respective year. A health interview survey, nutrition survey, and health examination survey (physical measurements, laboratory test results, BMD level and body mass index [BMI]) were administered. All surveys were conducted by trained interviewers who did not have any information about the participants; surveys were completed during home visit, and they were filled out by the participants or through an interview format. Informed consent was obtained from all participants and the questionnaires were randomly completed. This study was approved by the institutional review board of Severance Hospital, Yonsei University College of Medicine.
Initially we only selected postmenopausal women aged 45 to 70 years for this study. Women with thyroid dysfunction or women who underwent hysterectomy and/or bilateral oophorectomy, and early menopausal women whose age at menopause was less than 40 years were excluded. In addition, subjects who did not complete the questionnaires regarding smoking history, physical activity, history of hormonal therapy, menopausal age, and family history of fracture were not included. Women who did not provide blood samples for 25-hydroxyvitamin D (25(OH)D), nutritional information about their daily calcium intake, and anthropometric measurements, including height, weight, and waist circumference were excluded. Ultimately, 1,921 participants were included in this study. Subjects were divided into 6 subgroups according to the combination of daily calcium intake (calcium <400, Ōēź400 and <800, Ōēź800 mg/day) and serum 25(OH)D (Ōēż20 and >20 ng/mL) levels.
2. Measurements of the clinical variables and blood analysis
We collected clinical information from standardized questionnaires regarding participants' menopausal age, smoking history, physical activity, history of hormone replacement therapy, family history of fracture, and daily calcium intake. These surveys examined the anthropometric measurements including height, weight, and waist circumference, and we used the definition of obesity as BMI level equal to more than 25 kg/m2 (BMI Ōēź25 kg/m2). We divided subjects into two groups: never smokers and smokers (current smokers and ex-smokers). We defined regular physical activity as moderate or vigorous exercise for >20 minutes at least three times per week. The daily calcium intake amounts were obtained from the sum of the amounts of calcium contained in foods consumed individually per day.
Blood samples were collected after overnight fasting. Serum 25(OH)D levels were assessed by radioimmunoassay (DiaSorin, Stillwater, MN, USA) using a gamma-counter (1470, Wizard; PerkinElmer, Turku, Finland) and (25(OH)D) 125I RIA Kit (DiaSorin). All blood samples were analyzed at the central testing institute (NeoDin Medical Institute, Seoul, Korea). We defined a vitamin D deficiency as a serum 25(OH)D level less than 20 ng/mL according to the Endocrine Society's clinical practical guideline [2].
3. BMD measurement
BMD was measured using dual-energy X-ray absorptiometry at total hip, femur neck and lumbar spine (L1-L4). We divided participants into three groups: normal, osteopenic, and osteoporotic, according to the T-score level from the World Health Organization's criteria for BMD. We defined osteoporosis as BMD level -2.5 standard deviations (SDs) or lower and osteopenia as a BMD level between -1 SD and -2.5 SDs from the reference BMD level, otherwise, the BMD level was considered normal [11,12].
4. Statistical analysis
Continuous variables were compared by using one-way analysis of variance to evaluate differences between the six groups, and categorical variables were analyzed using the chi-square test or Fisher's exact test. Continuous and categorical variables are indicated as mean┬▒SD and values (percentages), respectively. To compare differences in the BMD levels of femur neck and lumbar spine between the low and high 25(OH)D level groups for each daily calcium intake level group, an analysis of covariance model was fitted with adjustments for age and weight. The result was indicated as estimated mean (standard error) and visualized with a figure for better understanding. To compare differences in the BMD levels of the femur neck and lumbar spine between the daily calcium intake level groups (<400, Ōēź400 and Ōēź800, Ōēź800 mg/day) groups for each 25(OH)D level group, analysis of covariance model was also fitted with adjustments for age and weight and the results were expressed in tables and figures. A trend test was performed to determine whether there was a significant trend in the BMD levels of the femur neck and lumbar spine among 6 subdivided groups. Logistic regression modeling was performed to determine the odds ratios (ORs) of prevalence of osteopenia and osteoporosis in other five groups compared to subjects taking calcium equal to greater than 800 mg per day and having sufficient serum vitamin D. All data analyses were performed by using SAS ver. 9.3 (SAS Institute Inc., Cary, NC, USA).
Results
The baseline characteristics of the participants are presented in Table 1. Among 1921 participants, numbers of people included in the group 1 to 6 were 669, 421, 408, 238, 97 and 88, respectively. The ages were 59.7┬▒6.5, 61.3┬▒6.2, 58.4┬▒6.7, 58.9┬▒6.1, 58.1┬▒6.4, 59.6┬▒6.3 years old, and the ages at menopause were 49.9┬▒3.9, 49.2┬▒3.8, 49.3┬▒3.7, 49.2┬▒3.5, 50.8┬▒3.6, 50.2┬▒3.4 years old (P<0.001, P=0.152, respectively). The mean BMI and the proportions of BMI, <18.5, Ōēź18.5 and <25, Ōēź25 kg/m2, were not statistically different among the 6 groups (P=0.609, P=0.197, respectively). Proportions of history of bone fracture, smoking history and estrogen therapy also did not show statistically significant differences among the 6 groups (P=0.797, P=0.522, P=0.468, respectively). The BMD of femur neck and lumbar spine were statistically different according to the 6 groups (femur neck: 0.610┬▒0.100, 0.654┬▒0.099, 0.626┬▒0.107, 0.655┬▒0.095, 0.624┬▒0.967, 0.658┬▒0.102 g/cm2, P<0.001; lumbar spine: 0.765┬▒0.115, 0.822┬▒0.117, 0.790┬▒0.132, 0.824┬▒0.132, 0.798┬▒0.126, 0.830┬▒0.132 g/cm2, P<0.001; respectively). The proportions of normal to osteopenia to osteoporosis, and normal to osteopenia and osteoporosis in femur neck and lumbar spine were statistically different among the 6 groups.
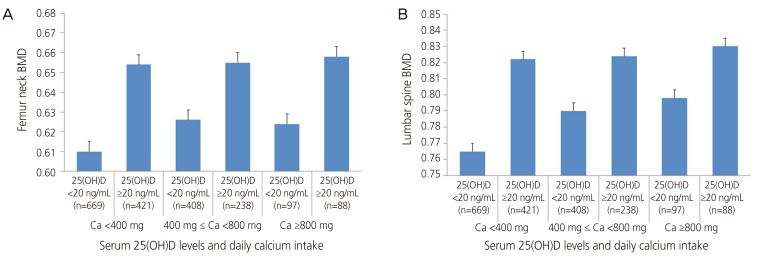
Table 2 shows comparisons of BMD in femur neck and lumbar spine, in between groups which were classified according to serum 25(OH)D levels, within daily calcium intake classifications. Among participants taking moderate amounts of calcium (400Ōēż calcium <800 mg/day), femur neck BMD showed tendency of difference according to the status of serum 25(OH)D (P=0.088). In the groups taking calcium <400 and Ōēź800 mg/day, femur neck BMD did not reveal significant difference according to serum vitamin D levels (P=0.351, P=0.892, respectively). Similarly, for lumbar spine BMD level, no significant difference was noted between the groups classified according to serum 25(OH)D levels, within each daily calcium intake group (P=0.388, P=0.458, P=0.487, respectively). These data are expressed in Fig. 1.
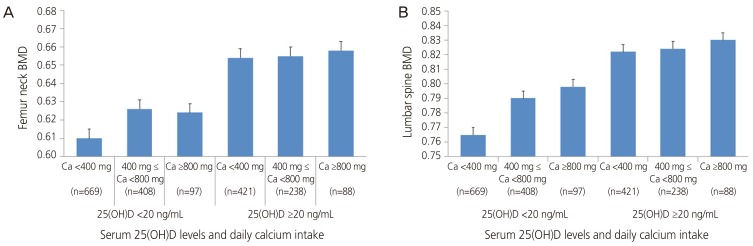
Contrary to Table 2, Table 3 shows comparisons of femur neck and lumbar spine BMD according to amounts of daily calcium intake within vitamin D sufficient and insufficient groups. There were no significant differences among the groups in both serum 25(OH)D <20 ng/mL and Ōēź20 ng/mL groups in femur neck BMD (P=0.508, P=0.311, respectively). On the other hand, in lumbar spine BMD, there was a significant trend toward the increase in BMD within vitamin sufficient group (P=0.087), whereas no difference was noted within vitamin insufficient group (P=0.624). These data are shown in Fig 2.
Table 4 shows OR for osteopenia and osteoporosis of femur neck and lumbar spine according to daily calcium intake and serum vitamin D levels. The logistic regression model was adjusted by age, BMI, physical activity, smoking history, history of estrogen therapy and history of fracture. The reference group was set as the subgroup of postmenopausal women whose calcium intake is Ōēź800 mg/day and serum 25(OH)D level Ōēź20 ng/mL, and the prevalence of osteopenia and osteoporosis in the rest 5 groups were compared with the reference group. The ORs of subjects taking daily calcium Ōēź400 and <800 mg/day with serum 25(OH)D <20 ng/mL, subjects taking daily calcium <400 mg/day and serum 25(OH)D <20 ng/mL, compared to the reference group were significantly higher in prevalence of osteopenia and osteoporosis in femur neck (OR 2.167, 95% confidence interval [CI] 1.195 to 3.932, P=0.011; OR 2.242, 95% CI 1.256 to 4.003, P=0.006; respectively). Comparing subgroups with the reference group, the ORs for lumbar spine in 4 groups were significantly different (group 1: OR 3.044, 95% CI 1.569 to 5.906, P=0.001; group 3: OR 2.721, 95% CI 1.382 to 5.359, P=0.004; group 4: OR 2.213, 95% CI 1.090 to 4.492, P=0.028; group 5: OR 2.993, 95% CI 1.372 to 6.530, P=0.006).
Discussion
We concluded that a lower daily calcium intake and insufficient serum vitamin D level may result in a low BMD in both femur neck and lumbar spine, with higher prevalence of osteopenia and osteoporosis in postmenopausal women. Lumbar spine BMD seems to be more affected by both insufficient daily calcium intake and serum vitamin D level than femur neck BMD. Moreover, although daily calcium is sufficiently taken, the lumbar spine BMD could be affected negatively when serum vitamin D is insufficient.
The effects of vitamin D and calcium are known to be considerable factors for maintaining BMD levels [13,14]. Although there is no consensus on optimal serum levels of 25(OH)D, most experts consider 25(OH)D less than 20 ng/mL to be vitamin D deficiency [15,16,17,18,19]. When serum 25(OH)D is deficient, it is known to affect bone metabolism through osteoclastic bone resorption and bone loss induced by increase in parathyroid hormone secretion as well as decrease in muscle mass and function [17,20]. Calcium is a mineral component which influences the skeletal and smooth muscles, which 99% is stored in the bones in the form of hydroxyapatite. Deficient dietary consumption of calcium leads to lower bone mineral content and BMD, which in long-term leads to osteopenia and osteoporosis [21].
Some previous studies tried to investigate on the relationship of vitamin D and calcium intake to BMD levels. One cross-sectional study conducted with Chinese adolescents concluded that the high-dose cholecalciferol therapy would improve calcium absorption, but the effect would not be significant and would not result in favorable effects on BMD level [22]. In one randomized controlled trial, they were to look for whether high dose of vitamin D would be better than the standard dose for increasing BMD and reducing bone turnover in postmenopausal women. They concluded that higher dosage of vitamin D than the standard dose would not alter or increase slightly with no significance on BMD in all measured sites in postmenopausal women [23].
Concurrently, there are relatively few studies on the relationship of both calcium and vitamin D on BMD status, and the efficacy of maintaining adequate levels of calcium and vitamin D for preventing osteoporotic fractures is still controversial [24]. Our purpose of the study was to reveal the prevalence of osteopenia and osteoporosis, not fracture. But, when considering the fracture risk increases in bone being in a status of osteoporosis, our study showed that when both daily calcium intake and serum vitamin D levels are not adequate, the risks of osteopenia and osteoporosis increase in both femur neck and lumbar spine. Also, insufficient levels of calcium and vitamin D seem to affect more on lumbar spine than on femur neck. Not consistent with our study, in one large randomized trial by Women's Health Initiative involving of more than 36,000 postmenopausal women, daily calcium intake of 1,000 mg with daily vitamin D intake of 400 IU did not have significant association on bone fracture, although post hoc analyses revealed significance within women 60 years old or older [25]. On the other hand, like our study, another meta-analysis showed both calcium and vitamin D supplementations would reduce fracture risk, especially in women with old age or those taking low amounts of calcium or vitamin D [26].
Previously, in one study reported that treatment of vitamin D deficiency in asymptomatic people might reduce mortality risk in elderly people and risk for falls but not fractures [27]. It emphasizes the importance of adequate level of serum vitamin D, but it is concluding that sufficient intakes of vitamin D would not decrease the fracture risk. Contrarily, our study showed the importance of maintaining adequate level of serum vitamin D by showing the increase risk of osteopenia and osteoporosis in lumbar spine, in a subgroup having insufficient amounts of serum 25(OH)D level with adequate daily calcium intake, when compared to the reference group.
Our analysis was not perfectly consistent with other previous studies. However, it is meaningful in investigating the combined effects on the postmenopausal femur and lumbar spine BMD levels and investigating on risks of osteoporosis in association with stratified vitamin D level and calcium intakes. Sufficient vitamin D level and enough daily calcium intakes undeniably have positive influences on BMD and bone health. But in the case of insufficiency in any of the 2 variables, BMD was negatively affected, especially on lumbar spine. Also, in the circumstance of lacking both calcium and vitamin D, the incidence of osteopenia and osteoporosis increased in 2.242 folds in femur neck and 3.044 folds in lumbar spine.
The strength of this study was that we used a representative sample of the overall South Korean population, and rigorous quality control measure the research with representative examples of the overall South Korean population, demanding quality controls were applied to the procedures in KNHANES. Consequently, we can consider that data from this study is reliable. Secondly, daily calcium intake and serum vitamin D levels, which are the most important variables that could affect osteoporosis and bone fracture, were simultaneously investigated.
On the other hand, one of the drawbacks of this study is that this investigation was retrospective cross-sectional design that direct relationship between the variables could not be obtained through this study. Further studies will be needed to obtain more precise values for serum vitamin D levels and amounts of dietary calcium intakes. Also, selection bias might have occurred considering the cultural and habitual behavior difference and some other factors such as geographic location might have affected calcium intake or serum vitamin D levels, which could not be considered in our study [28].
The vitamin D and daily calcium intake are significant variables that affect the BMD in both femur neck and lumbar spine in postmenopausal women. Also, although daily calcium intake is sufficient, the lumbar spine BMD could be affected negatively when serum vitamin D is not sufficient, increasing the risks of osteoporosis. Therefore, supplementing vitamin D and calcium for postmenopausal women would be crucial for preventing osteoporosis and fracture.


")