

Introduction
Ovarian cancer is one of the most fatal malignancies and the leading cause of mortality in cancers associated with the female genital tract, with an estimated 184,799 deaths reported worldwide in 2018 [1]. More than 70% of ovarian cancer cases are diagnosed at an advanced stage and are accompanied by disseminated peritoneal diseases [2]. Distinct molecular phenotypes in ovarian cancer show heterogeneous treatment responses and biological behaviors. For instance, although the high-grade serous subtype is more sensitive to chemotherapy, it is also more aggressive than low-grade subtypes. Thus, identification of gene expression signatures with key clinicopathological parameters may facilitate the precise estimation of survival, and consequently lead to the development of personalized treatment strategies. Based on recent advances in genomic sequencing techniques, it is possible to explore the significant genetic variants and expression characteristics of ovarian cancer.
Arylacetamide deacetylase (AADAC) is a protein-coding gene located in human chromosome 3. The translated product of AADAC competes with cytosolic arylamine N-acetyltransferase activity in the cytochrome P450 pathway and is associated with the biotransformation, hydrolase activity, triglyceride lipase activity, and hydrolysis of clinical drugs [3-5]. AADAC is a tissue-specific protein-coding gene that is mainly expressed in normal liver tissues and shows extremely low expression in normal ovarian tissues [6]. However, the role of AADAC in the prognostication of ovarian cancer remains inconclusive. Thus, our study aimed to identify and validate the correlation between AADAC expression and survival in ovarian cancer cases using integrated bioinformatics analyses. The results of the present study indicated that ovarian cancer cases with high AADAC expression signatures were associated with better overall survival. Furthermore, upregulation of AADAC was correlated with increased CD4+ memory T cell infiltration in the tumor microenvironment. Finally, by integrating the signature score of AADAC expression with clinicopathological parameters, we constructed a nomogram to demonstrate its potential utility in predicting the survival of patients with ovarian cancer.
Materials and methods
1. Acquisition of multi-omics data on ovarian cancer
Gene expression profiles (RNA-sequencing data) of The Cancer Genome Atlas-ovarian cancer (TCGA-OV) cohort were retrieved from TCGA using the University of California, Santa Cruz, Xena browser (USCS Xena) datahub (https://xenabrowser.net/; accessed on October 12, 2020), which is a high-performance visualization and analysis tool for both large public repositories and private datasets [7]. The data included HTSeq-counts and fragments per kilobase of transcript per million values of 379 cases with patient follow-up information. TCGA-OV cohort was used as the training dataset.
Raw microarray data of the GSE18520 and GSE26712 datasets were accessed from the Gene Expression Omnibus (GEO; https://www.ncbi.nlm.nih.gov/geo/). The GSE18520 dataset comprised of gene expression profiles from 53 high-grade primary papillary serous ovarian adenocarcinoma specimens and 10 normal ovarian surface epithelium brushing specimens, which were evaluated using the Affymetrix Human Genome U133 Plus 2.0 Array (Affymetrix, Inc., Santa Clara, CA,USA); while the GSE26712 dataset comprised of 185 primary ovarian tumour samples and 10 normal ovarian surface epithelium samples, which were detected using the Affymetrix Human U133A microarray (Affymetrix, Inc.). For the validation studies, we used the GSE140082 dataset, which comprised of data on the gene expression arrays from 380 formalin-fixed paraffin-embedded ovarian cancer samples and overall survival information of the patients, which was also obtained from the GEO database and evaluated using Illumina HumanHT-12 WG-DASL V4.0 R2 Expression BeadChip Array (GEO; NCBI, Bethesda, MD, USA). Details of the primary data used in this study are presented in Table 1.
2. Quality control and processing of the multi-omics data
The quality of the raw data obtained from the GSE18520 and GSE26712 datasets was assessed using the “array-QualityMetrics” (version 3.44.0; Bioconductor) package [8]. A robust multi-array average algorithm was used for data normalization and background correction. Different microarray scanning times were considered as a known batch effect, which was examined using the ComBat function of the “sva” (version 3.36.0; Bioconductor) package [9]. Batch effect control was performed by using a principal component analysis through the “FaceFactoMineR” (version 2.4; Bioconductor) package [10]. The gene annotation file (gencode.v35.annotation.gtf..gz, https://www.gencodegenes.org/; accessed on October 12, 2020) of the human genome was used to extract data on protein-coding genes and was downloaded from GENCODE (https://www.gencodegenes.org/; accessed on October 12, 2020). Quality annotations of TCGA-OV samples were performed according to the merged_sample_quality_annotations.tsv file (https://gdc.cancer.gov/aboutdata/publications/pancanatlas). The workflow of the quality control process of TCGA-OV samples is shown in Supplementary Fig. 1. A variance inflation factor was used to detect the severity of multicollinearity between the gene signature and clinicopathological parameters.
3. Differential expression analysis of the protein-coding genes
Differential expression analysis of the protein-coding genes between the normal and cancerous ovarian samples obtained from the GEO datasets was performed using the “limma” (version 3.44.3; Bioconductor) package [11]. The batch effects of the scanning time in the microarray datasets were integrated into the limma model design to conduct further differential expression analysis. Genes with |logFC| >1 and adjusted P<0.05, were considered differentially expressed.
4. Identification of survival-associated protein-coding genes
The value of protein-coding gene expression on survival was determined using a univariate Cox proportional hazards model analysis (log-rank P<0.05) in the TCGA-OV training cohort.
5. Univariate and multivariate Cox regression model analyses and validation
The intersection data between the potential survival-associated genes and differentially expressed genes were filtered using a least absolute shrinkage and selection operator (LASSO)-penalized Cox regression analysis. Only genes with non-zero coefficients via the minimum criteria (a λ value of 0.066 with log [λ]= −2.718 were selected by a 10-fold cross validation) in the LASSO regression model were chosen to further estimate the prognostic significance using univariate and multivariate Cox regression analyses. Next, Kaplan-Meier survival curves were plotted and the log-rank method was used to estimate the prognostic significance. The signature score of a specific gene was calculated by multiplying the gene expression values by the coefficients. A time-dependent receiver operating characteristic (ROC) curve was plotted to investigate the predictive accuracy using the “survivalROC” (version 1.0.3; CRAN) package [12]. Finally, the validation cohort GSE140082 was used to verify the prognostic significance of the gene signature.
6. Estimation of immune infiltration and immunological signature gene set enrichment in ovarian cancer
xCell [13], a webtool and gene signature-based method was used to perform cell type enrichment analysis based on the gene expression data of 64 immune and stromal cell types. Data on immunological signature gene sets, which represent the cellular states and perturbations within the immune system, were downloaded from the Molecular Signatures Database v7.2 (MSigDB), Broad Institute (https://www.gseamsigdb.org/; accessed on October 12, 2020).
7. Construction of the nomogram for the gene signature
In the TCGA-OV cohort, the following parameters were selected to construct a nomogram using the “survival” (version 3.2-10; CRAN) [14] and “rms” (version 6.1-1; CRAN) packages: age, stage, grade, and residual disease along with the gene signature score [15]. Calibration curves were plotted to assess the concordance between the actual and predicted survival. A time-dependent ROC curve was plotted to investigate the predictive accuracy of the nomogram.
8. Statistical analysis
An adjusted P-value <0.05, with |logFC| >1, was considered significant for differential gene expression analysis. The Kaplan-Meier method and log-rank test were used to estimate the impact of the gene signature on survival. Statistical significance was set at P<0.05. A significant Spearman’s correlation coefficient was estimated with a P-value <0.05. All data were processed using the R software (version 4.0.2 [×64]; R-project) platform.
Results
1. Clinicopathologic characteristics in the training and validation cohorts
The clinicopathologic characteristics (including age, stage, grade, residual disease, and/or debulking surgery) of the training and validation cohorts are summarized in Table 2.
2. Differentially expressed protein-coding genes in ovarian cancer
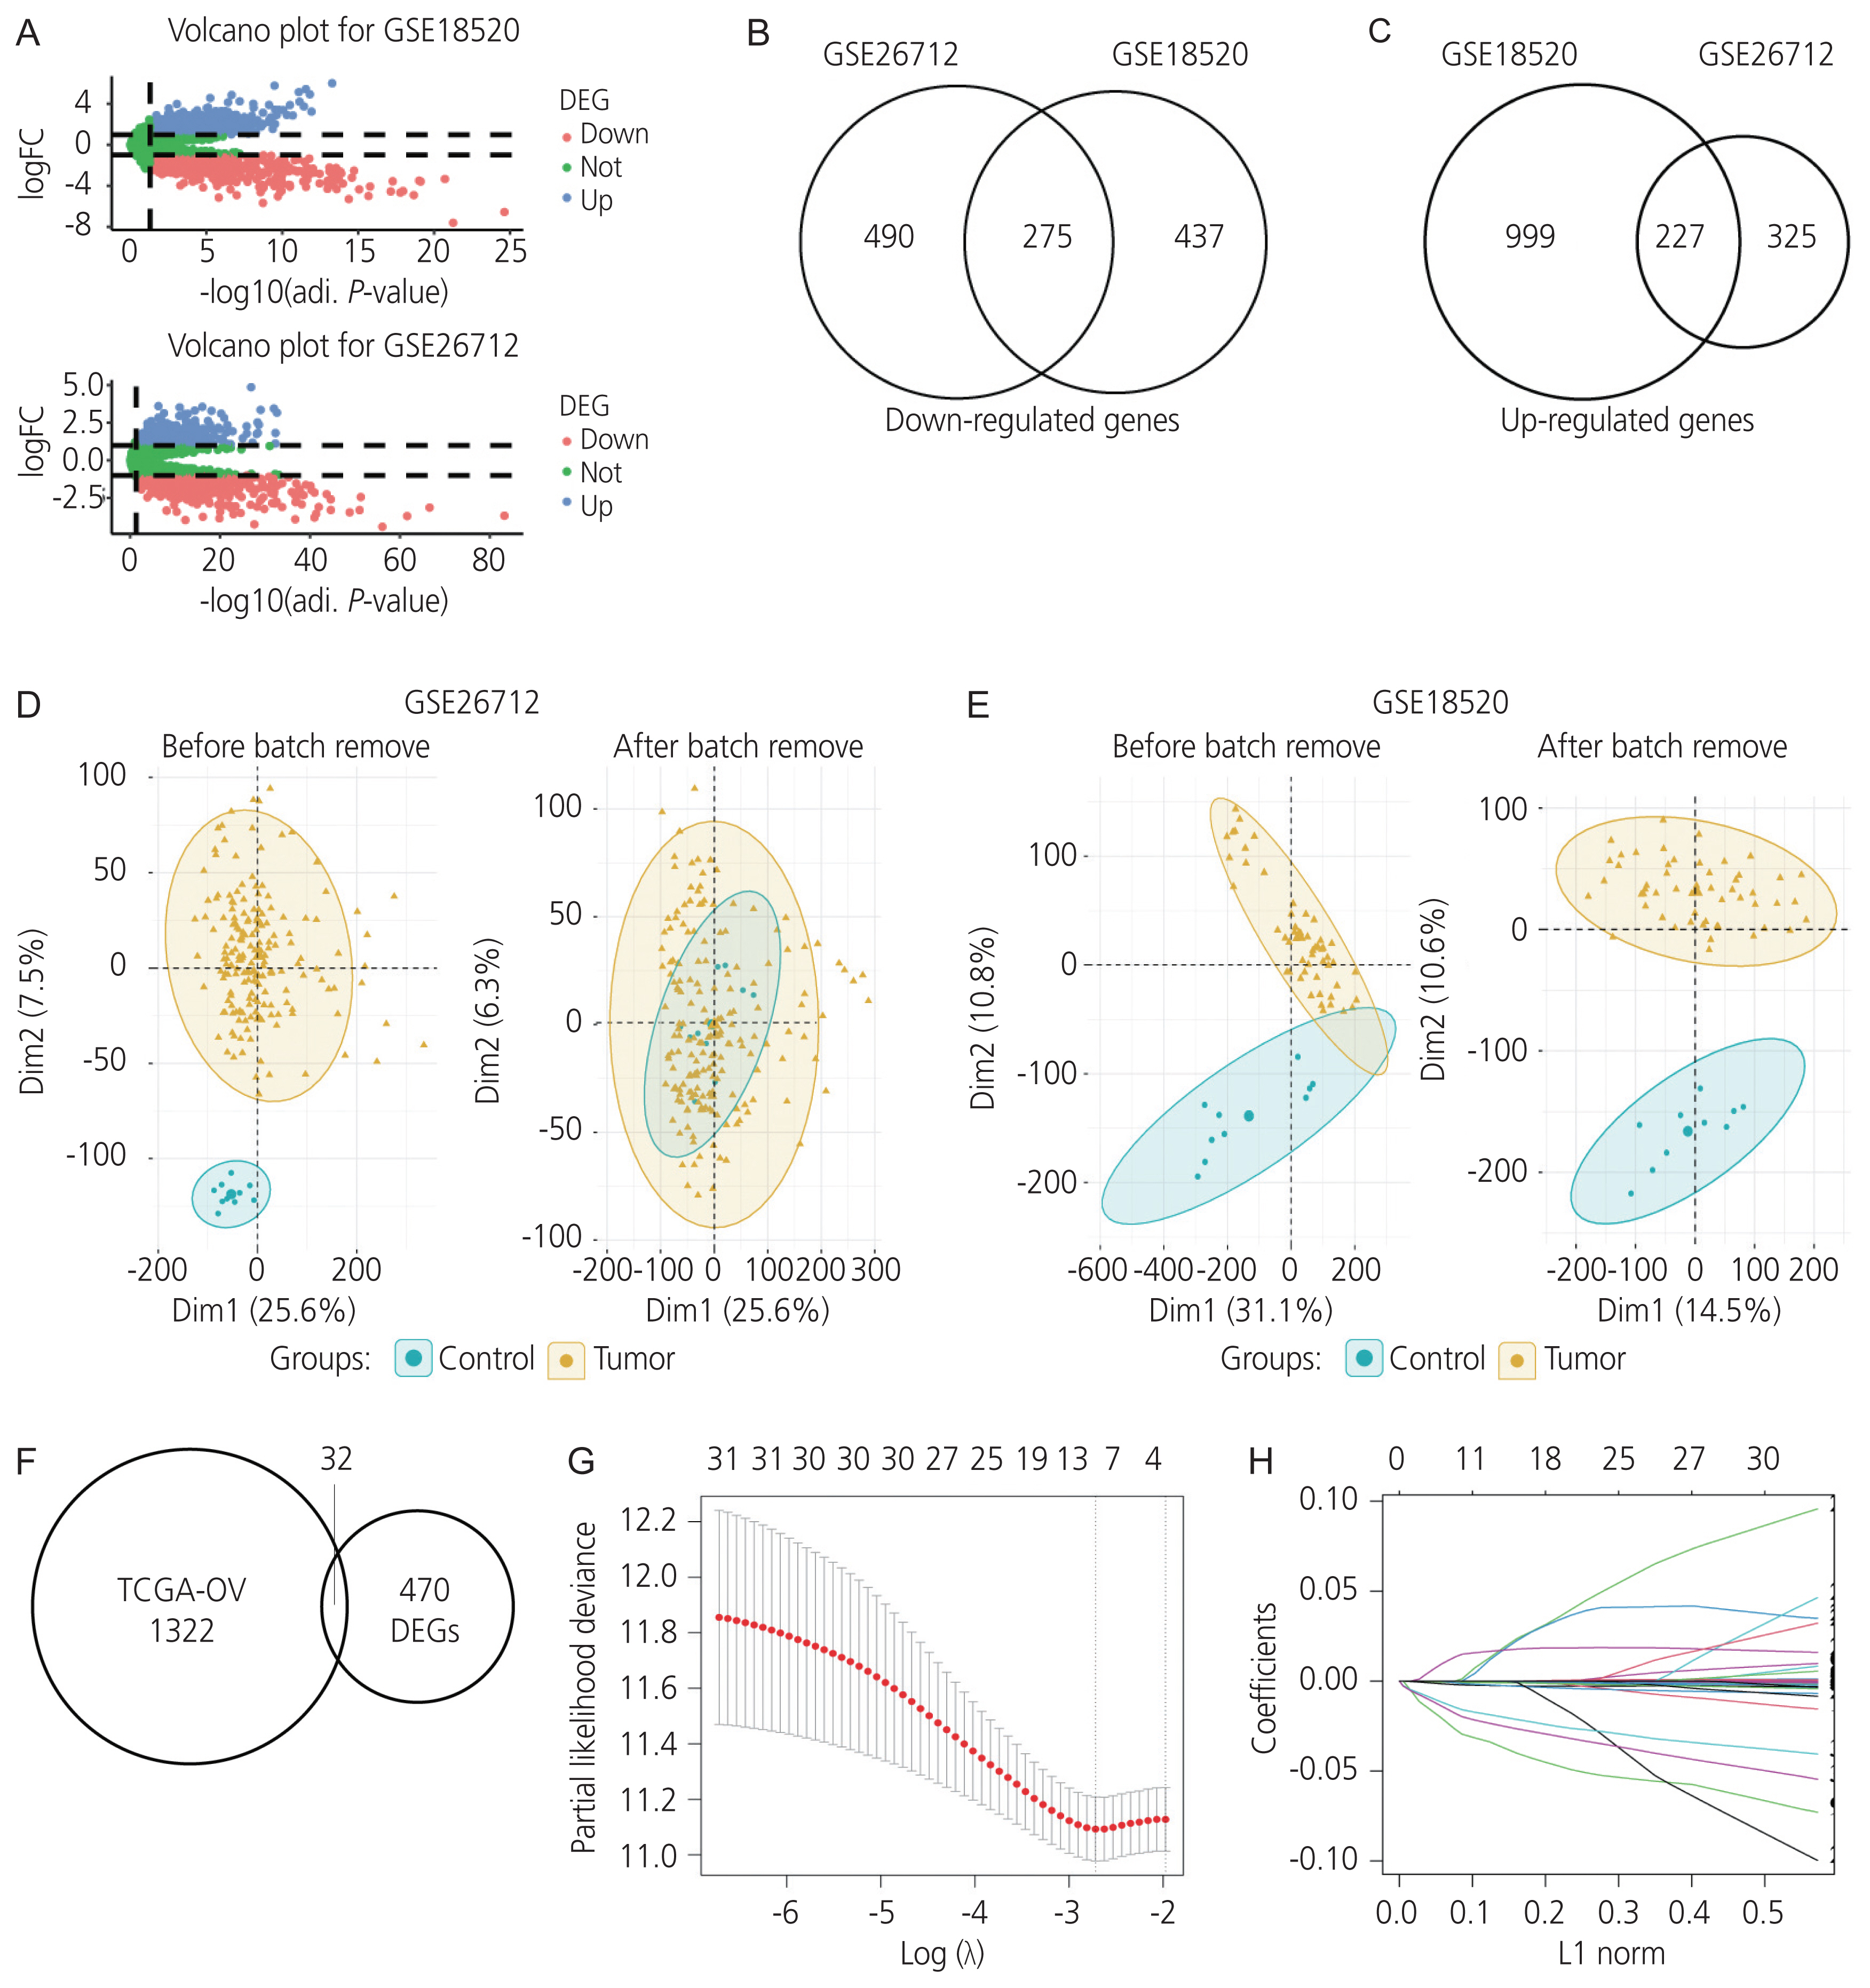
Normal ovarian samples and ovarian cancer samples from the GSE18520 and GSE26712 datasets were compared according to the adjusted P-value <0.05, and |logFC| >1. The batch effect, which was the scanning time in the two microarray profiles, was integrated into the differential expression analysis model and visualized using principal component analysis (Fig. 1D, E, respectively). In the GSE18520 dataset, 1,226 and 712 protein-coding genes were significantly upregulated and downregulated, while in the GSE26712 dataset, 552 and 765 protein-coding genes were upregulated and downregulated, respectively. Volcano plots of the differentially expressed genes are shown in Fig. 1A. Based on the data of these genes, an intersection of 502 differentially expressed (227 upregulated and 275 downregulated) protein-coding genes was observed, and these genes were selected for further analysis (Fig. 1B, C).
3. Survival-related differentially expressed protein-coding genes in ovarian cancer
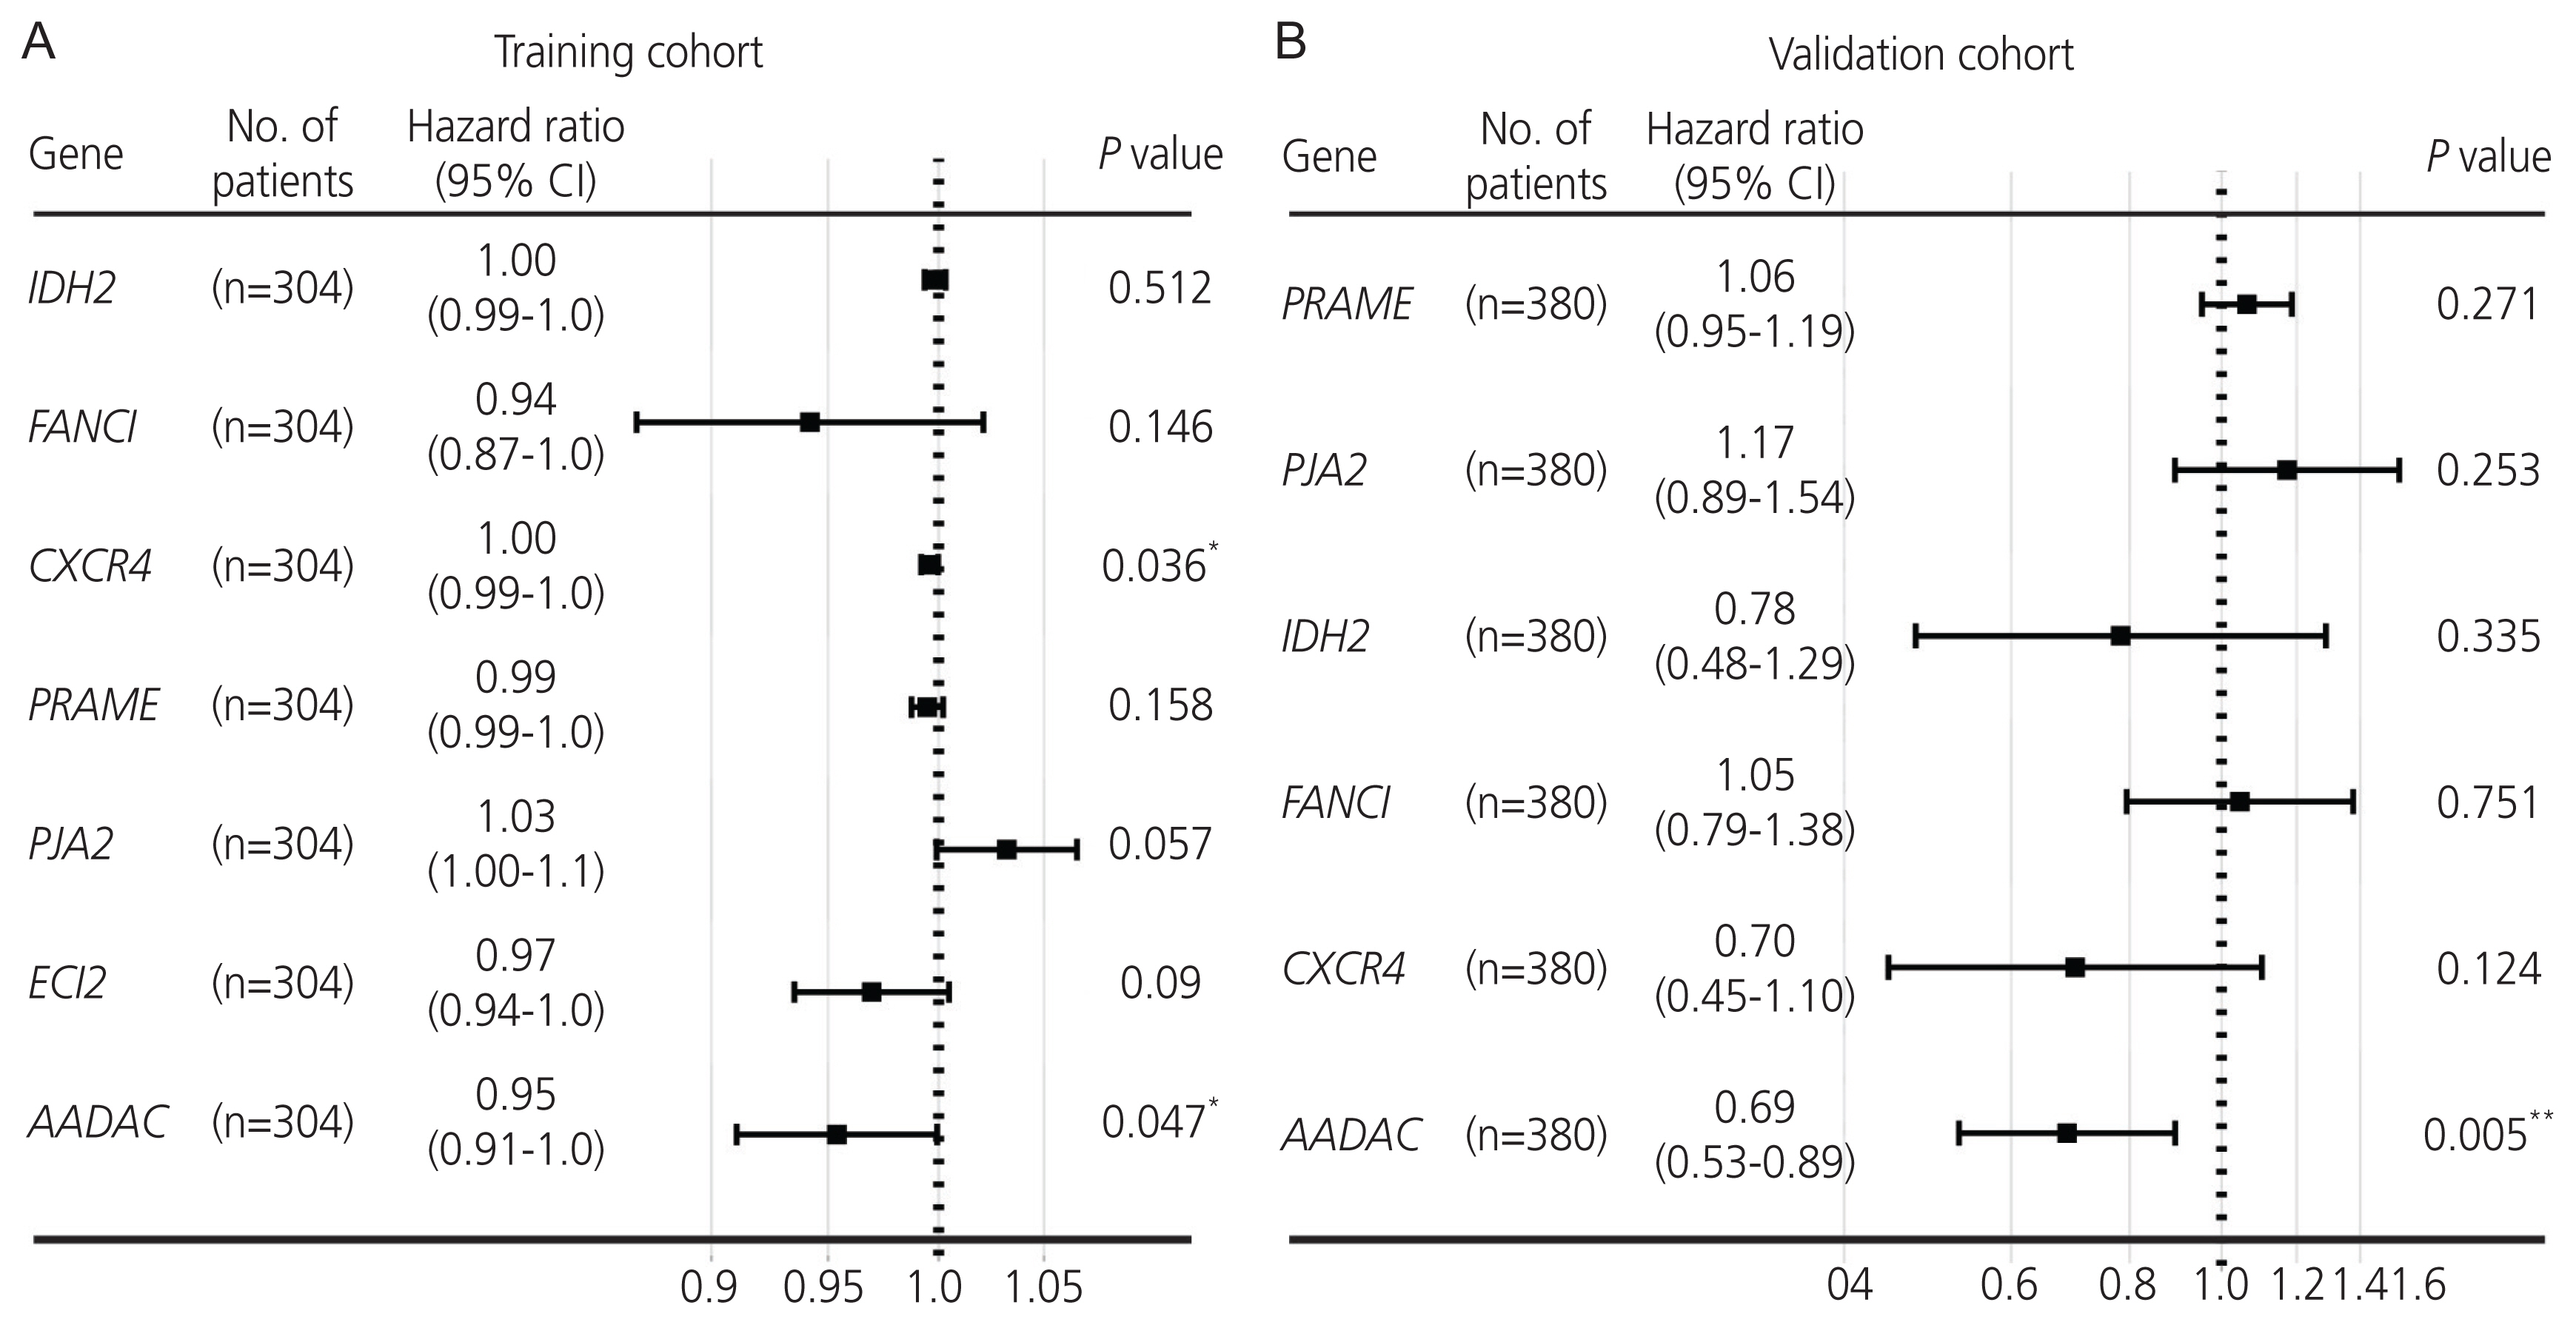
The correlation between the differentially expressed protein-coding genes and survival in the TCGA-OV cohort was analyzed using a univariate Cox regression analysis (P<0.05). A total of 1,354 protein-coding genes were significantly associated with survival in ovarian cancer, and 32 intersecting protein-coding genes from TCGA-OV, GSE18520, and GSE26712 datasets were screened for prognostic value in ovarian cancer (Fig. 1F). Furthermore, data on these 32 genes were filtered using the LASSO-penalised Cox regression analysis (Fig. 1G, H). Moreover, seven genes, including isocitrate dehydrogenase (IDH2), FA complementation group I (FANCI), C-X-C motif chemokine receptor 4 (CXCR4), PRAME nuclear receptor transcriptional regulator (PRAME), praja ring finger ubiquitin ligase 2 (PJA2), enoyl-CoA delta isomerase 2 (ECI2), and AADAC, were identified for conducting further univariate and multivariate Cox regression validation analyses. Finally, univariate and multivariate Cox proportional hazard regression analyses performed using both the training and validation cohorts verified that AADAC was significantly and independently correlated with prognosis in ovarian cancer (Table 3, Fig. 2).
4. AADAC expression signature is associated with prognosis in ovarian cancer
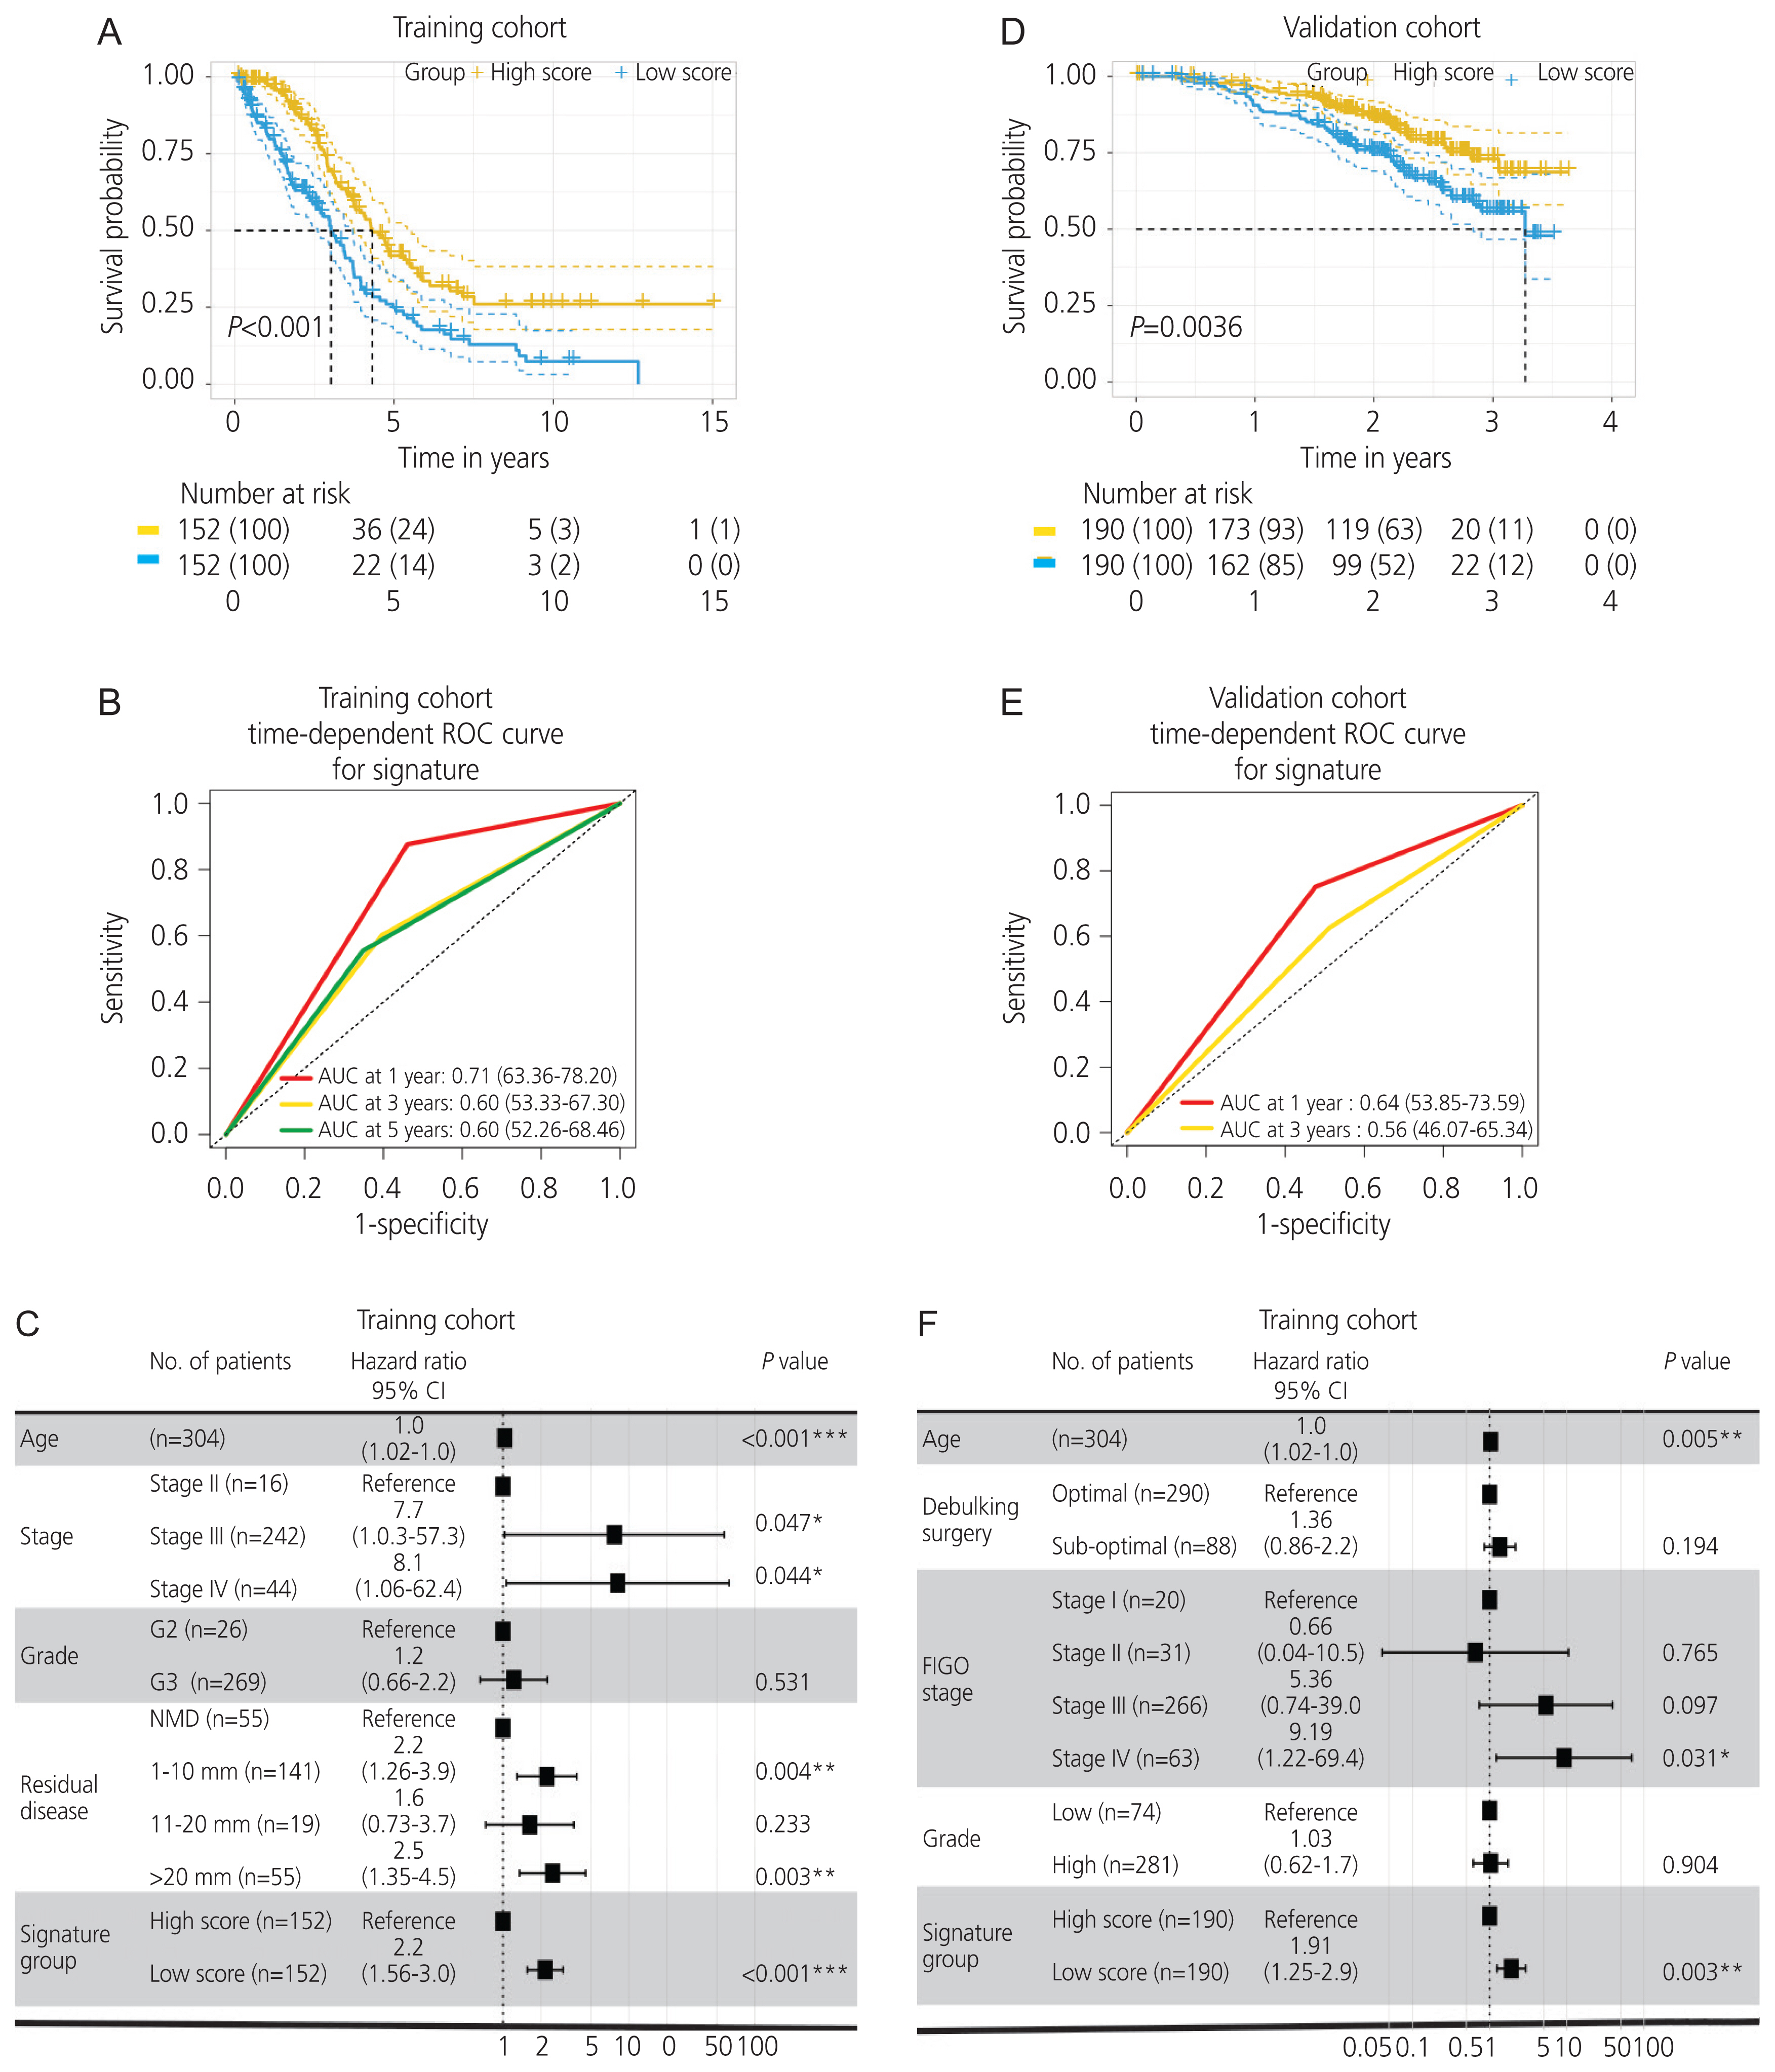
The samples were classified according to the median AADAC expression score then grouped as high -and low-score signature groups. The Kaplan-Meier analysis revealed a significant difference in the outcome of the patients with ovarian cancer between the high- and low-score signature groups (log-rank test P<0.05; Fig. 3A, D). A better survival outcome was significantly correlated with the high-score AADAC expression signature in the subgroup analysis (Fig. 3C, F). The time-dependent area under the ROC curves (AUC) for 1-, 3-, and 5-year survival in the training and validation cohorts are illustrated in Fig. 3B, E, respectively. After combining the AADAC signature score with the clinicopathological parameters (age, stage, grade, residual disease, and/or debulking surgery) in both cohorts, multivariate Cox regression and subgroup analyses were conducted, which further indicated that the high-score AADAC expression signature was significantly and independently correlated with favorable prognosis in ovarian cancer (Fig. 3C, F). The evaluation of the variance inflation factor suggested that the AADAC expression signature showed less collinearity with the other clinical variables in the model (Supplementary Fig. 2). In order to illustrate the reliability of the signature, we sudivided the groups based on the upper and lower quantiles of the AADAC expression signature score into the following: top 25%, bottom 25%, and 25-75% subgroups, and the results still demonstrated a favorable prognosis in the top 25% high-score subgroup (Supplementary Fig. 3).
5. Immune infiltration and immunological signature enrichment in ovarian cancer
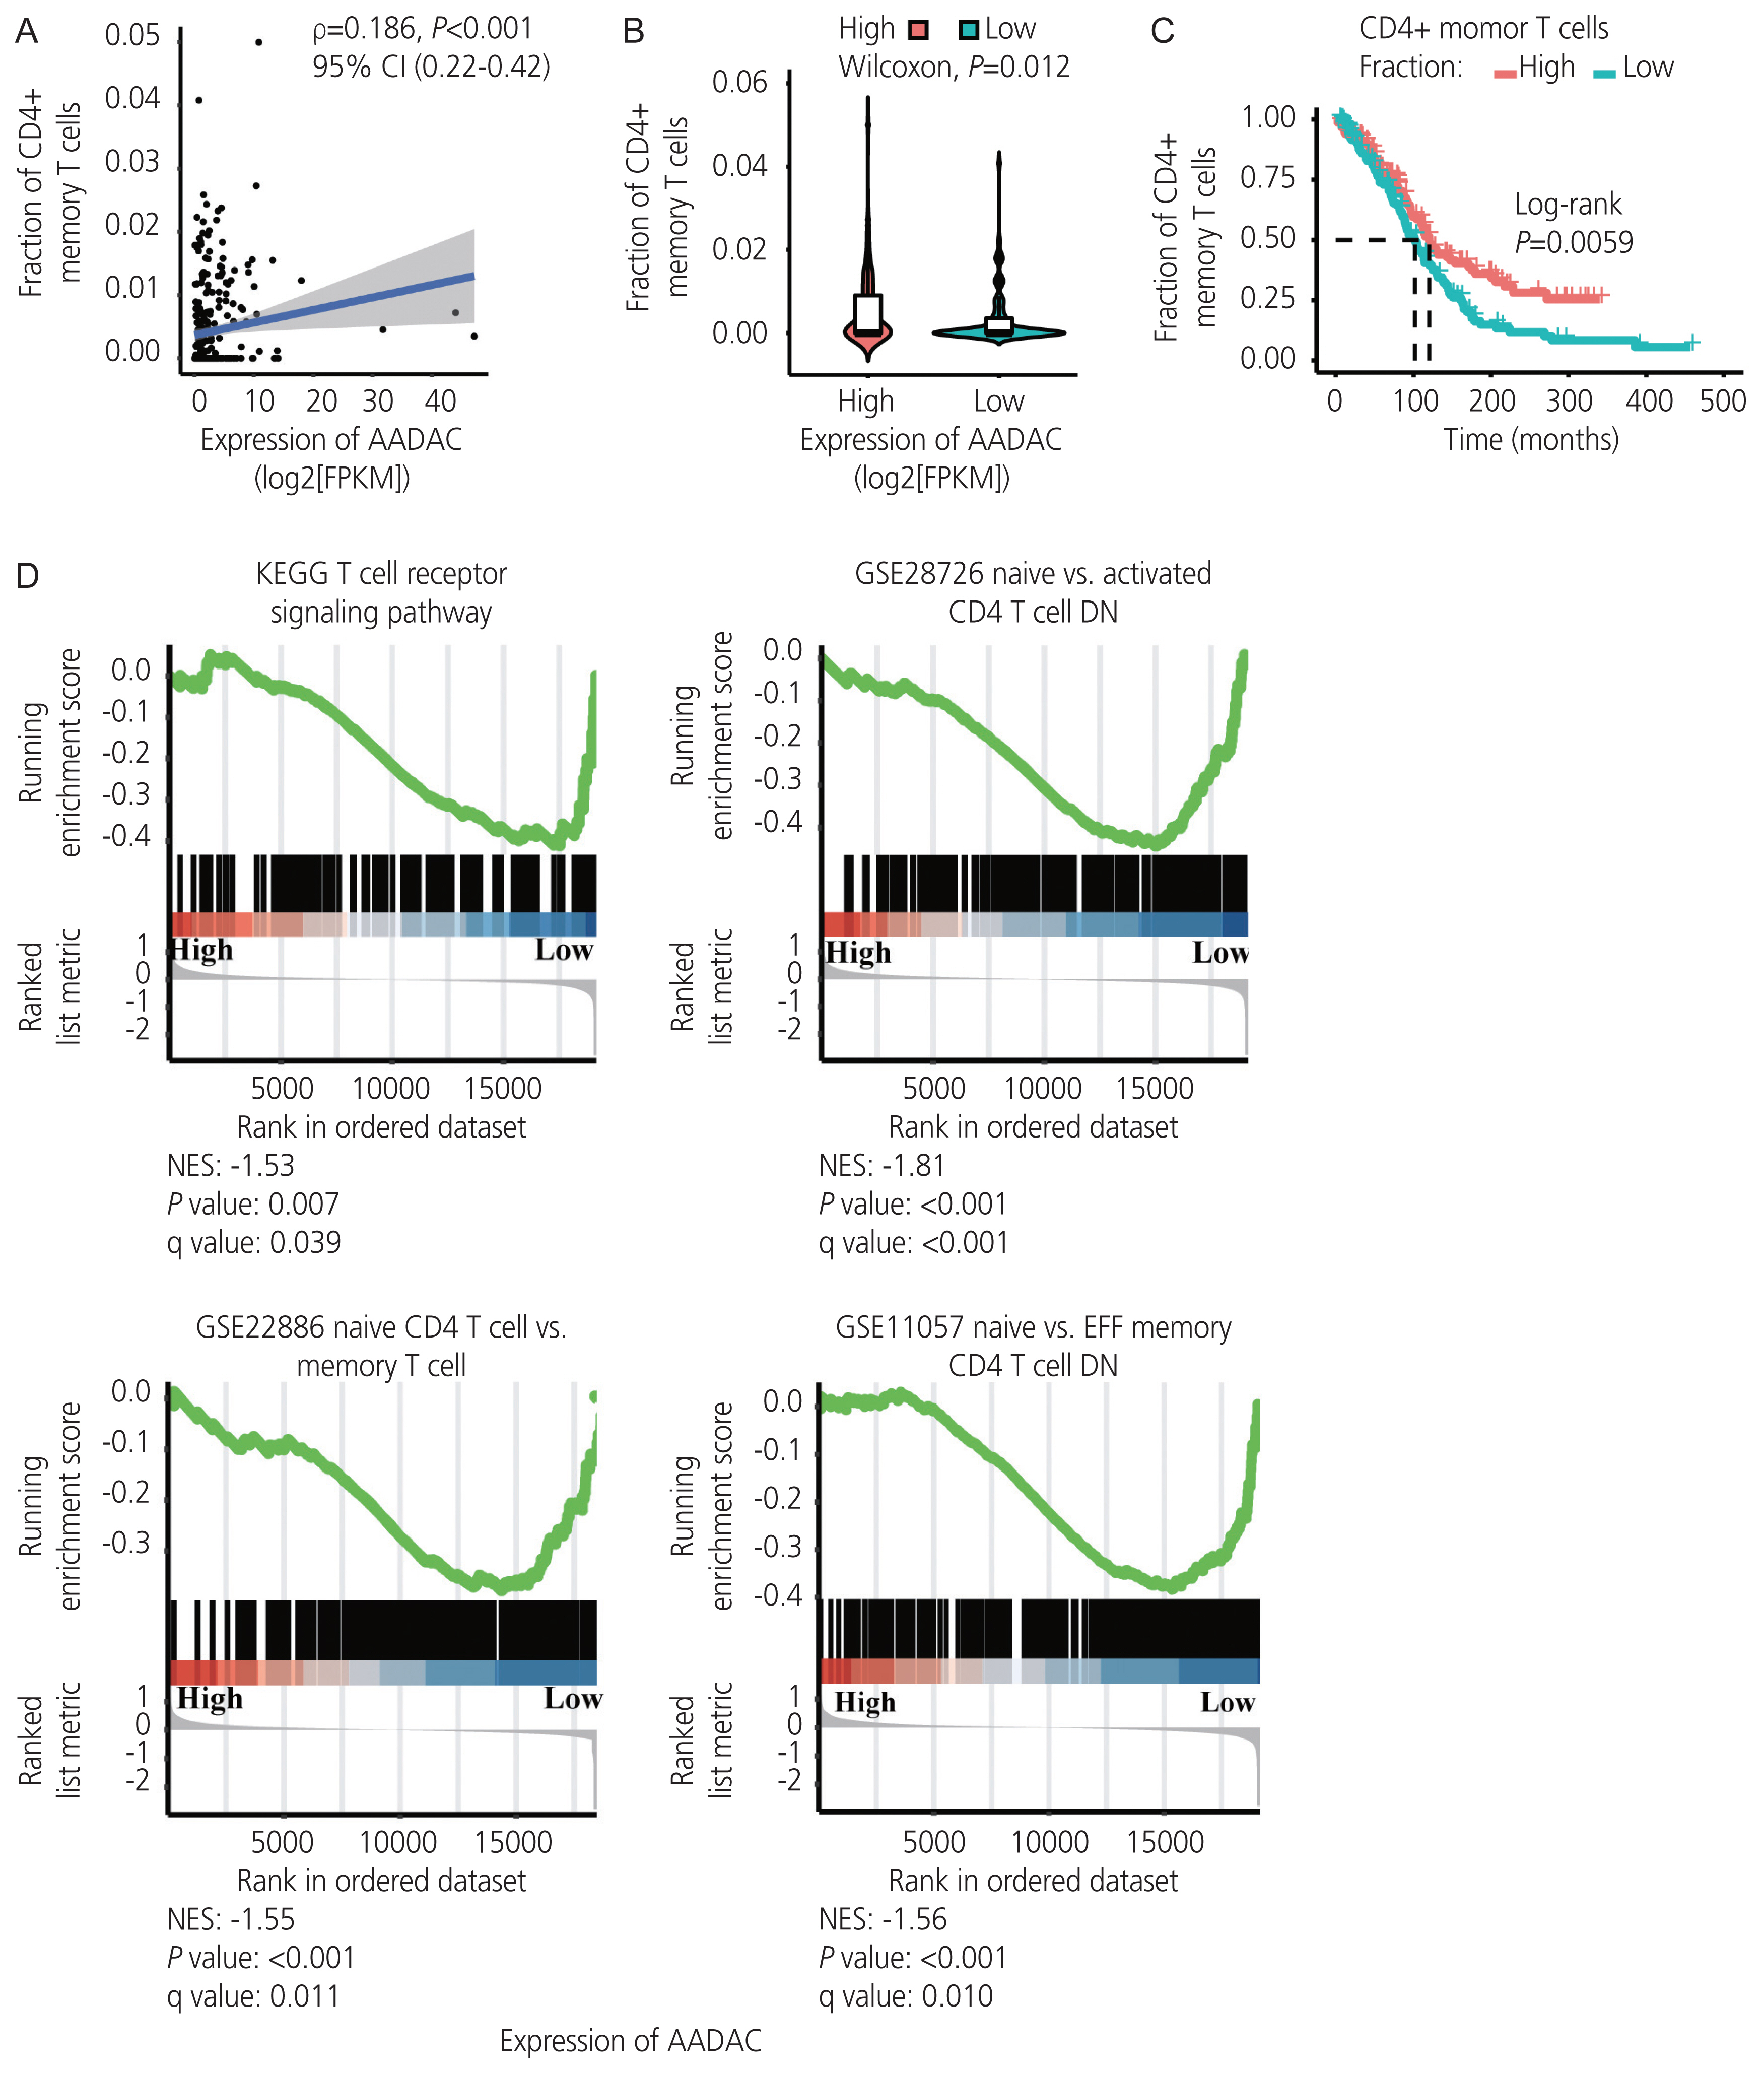
Immune infiltration in ovarian cancer was estimated using the xCell algorithm. We found that an increased extent of CD4+ memory T cell infiltration was significantly correlated with the upregulation of AADAC (ρ=0.18; P<0.001; 95% confidence interval [CI], 0.22-0.42; Fig 4A, B), and was associated with a better survival outcome (Fig. 4C). Furthermore, the immunological signature enrichment analysis demonstrated that upregulated AADAC expression was significantly enriched in genes that were overexpressed in the T cell receptor pathway and CD4+ T cell regulation (Fig. 4D).
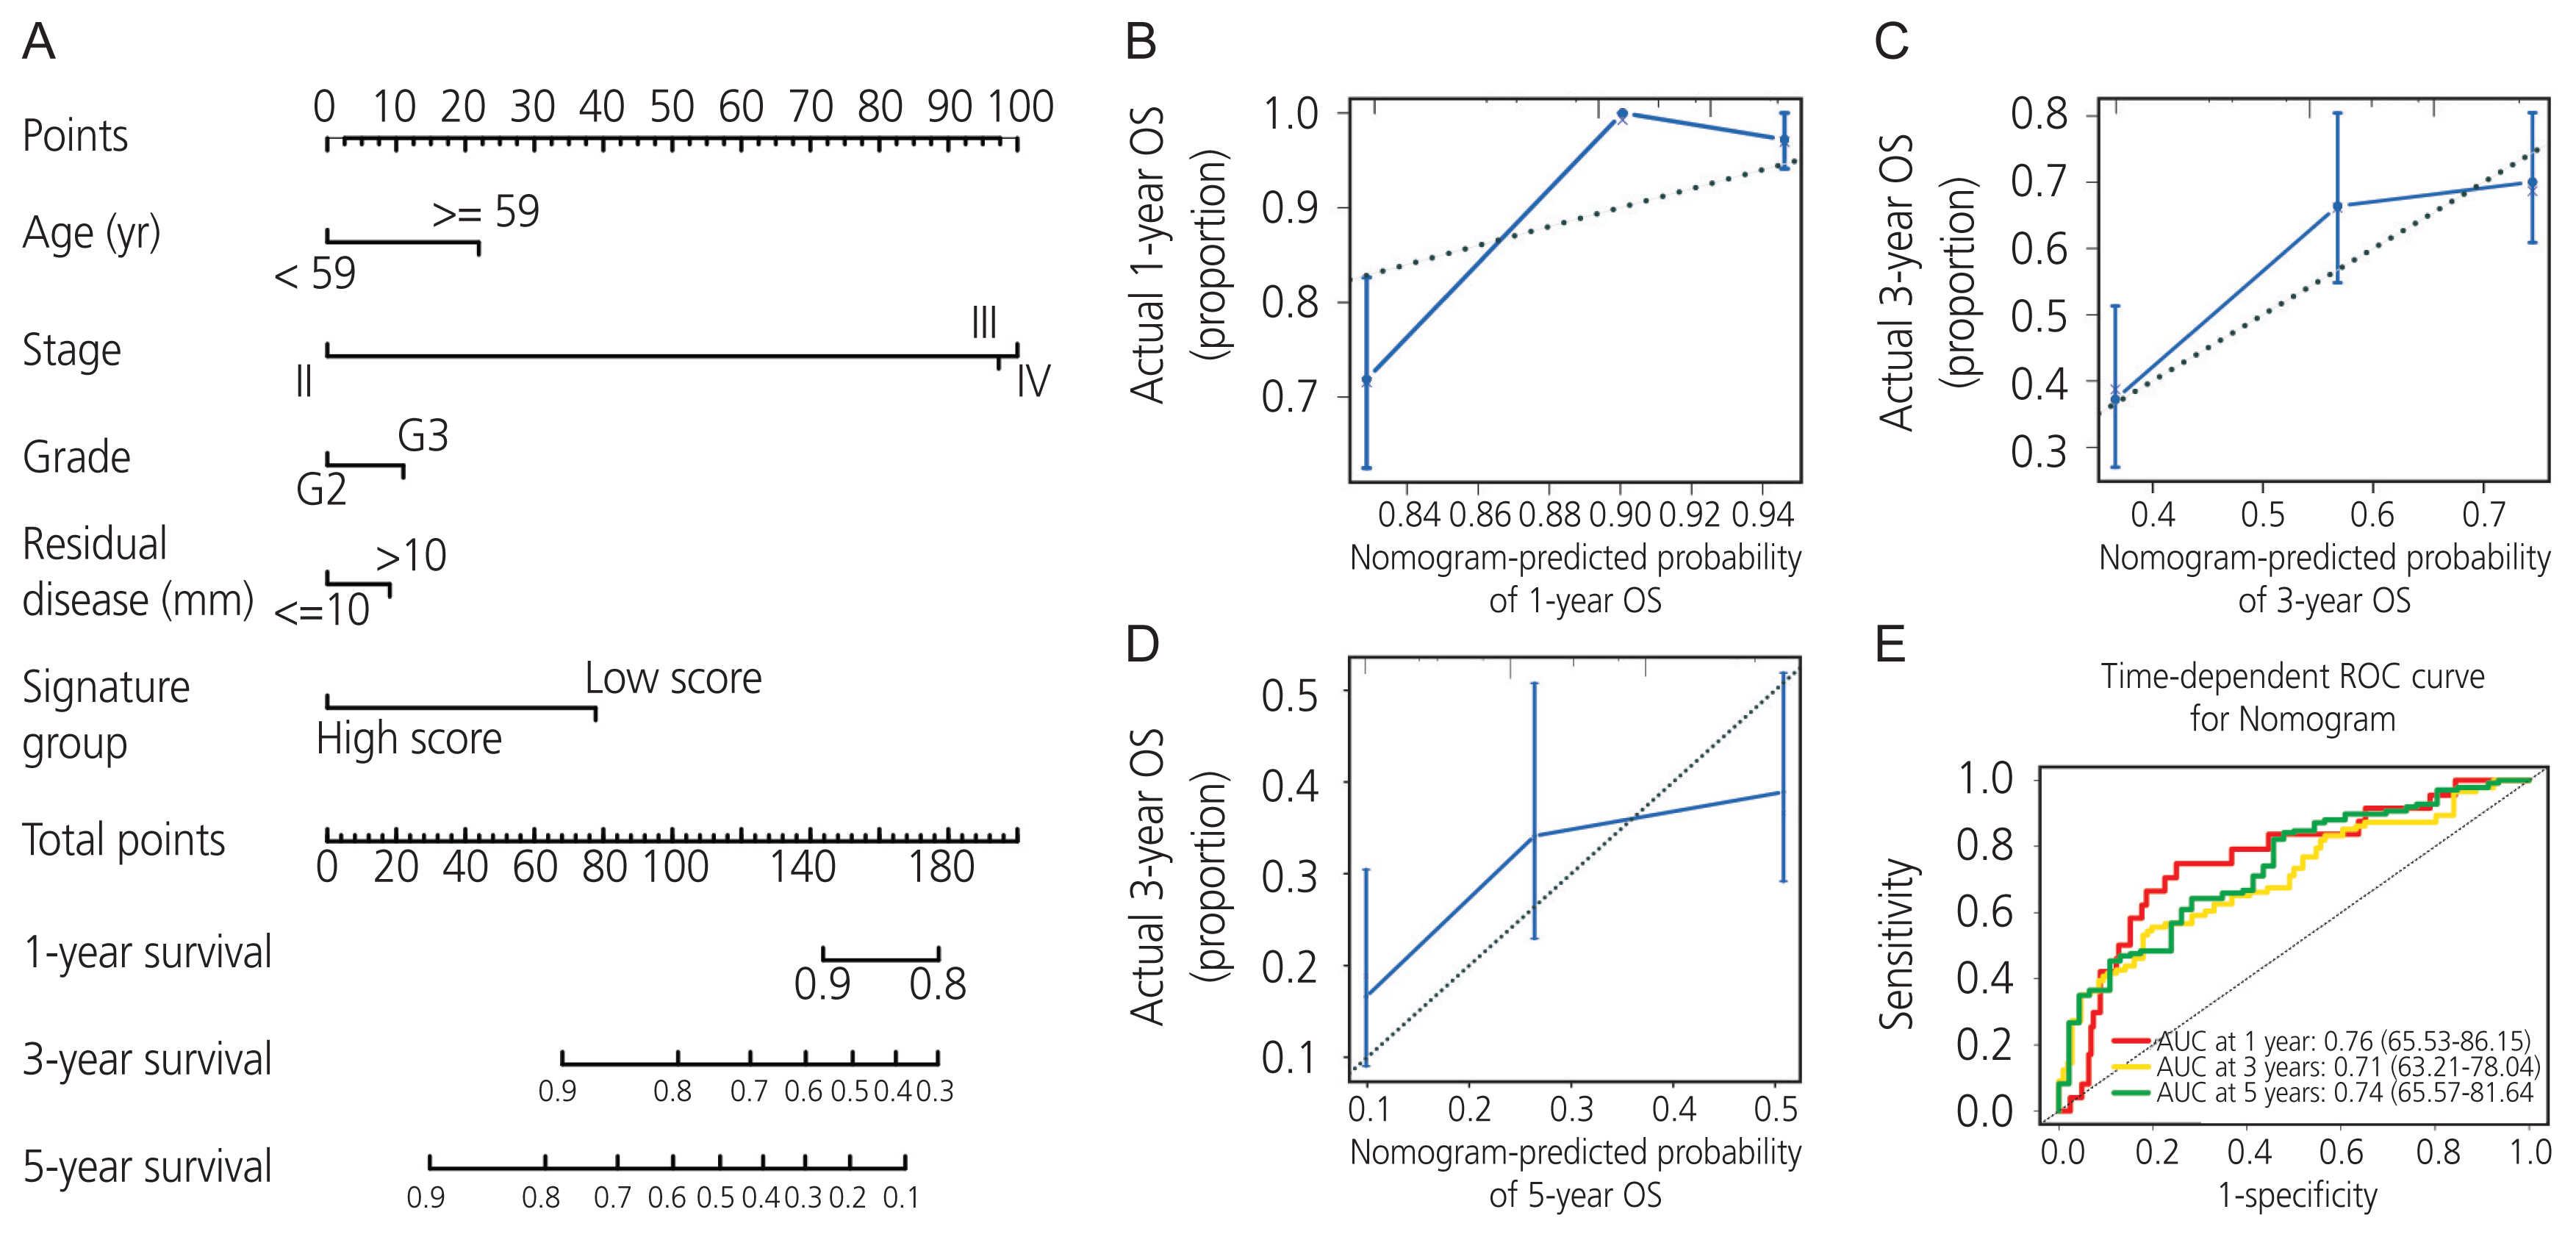
6. Nomogram model for the AADAC expression signature with clinicopathologic parameters based on TCGA-OV cohort
We combined the AADAC expression signature score with feasible clinicopathologic parameters, including age, stage, grade, residual disease, and signature score (Fig. 5A). Each patient was assigned one point for each prognostic parameter: the higher the total number of points, the poorer the outcome. The calibration plots of the nomogram and an ideal model were compared; the nomogram showed moderate performance (Fig. 5B-D). Moreover, the time-dependent AUC of 1-, 3-, and 5-year overall survival demonstrated that our model had a moderate predictive ability (Fig. 5E).
Discussion
Ovarian cancer is the most fatal malignancy associated with the female genital tract [2,16]. Most patients are diagnosed at an advanced stage with early peritoneal dissemination at the primary diagnosis. Patients encounter a disastrous relapse even after undergoing primary debulking cytoreduction surgery and adjuvant platinum-based chemotherapy [16]. Exploration of the significant gene expression characteristics in cancerous samples can directly indicate the inherent molecular heterogeneity in ovarian cancer cells [17-19]. With the development and advancement of multiple “omics” sequencing techniques, the processing of considerable and complex sequencing data using comprehensive and integrated bioinformatics methodologies can help us better understand the underlying molecular characteristics of the cancer genome. In this study, we utilized bioinformatics approaches to estimate the prognostic impact of AADAC in ovarian cancer.
AADAC is a tissue-specific protein-coding gene in humans [5] that is highly expressed in the liver but not in the ovarian tissues [3,5,6]. The translated product of AADAC participates in various activities related to enzymatic bioactivation reactions [5,20]. Jiang et al. [21] demonstrated that intestinal AADAC is involved in vicagrel hydrolytic bioactivation to further influence platelet function. The platelet-lymphocyte ratio has been associated with survival outcomes in various cancer subtypes [22-24]. Recently, Toyohara et al.[25] found that elevated AADAC expression in vascular smooth muscle cells was correlated with cell proliferation, migration, and apoptosis.
In the present study, univariate and multivariate Cox regression analysis results indicated that AADAC overexpression was significantly associated with better survival in patients with ovarian cancer. Furthermore, survival analysis revealed that, compared with a low-score signature, a high-score signature of AADAC expression was significantly and independently related to better outcomes in patients with ovarian cancer. Similarly, Liu et al. [26] suggested AADAC expression (hazard ratio, 1.112; 95% CI, 1.042-1.186) as a prognostic gene signature with applicability in predicting the overall survival in gastric cancer via an integrated analysis of multiple gene expression profiles. Finally, we constructed a nomogram based on TCGA-OV cohort and clinicopathologic parameters, including the signature score of AADAC expression, age at diagnosis, tumor grade, tumor stage, and residual disease status. The nomogram constructed in the present study demonstrated a moderate potential for predicting ovarian cancer prognosis in clinical practice.
Immune infiltration is highly heterogeneous in ovarian cancer [27,28]. The T cell population participates in the elicitation of an anti-tumor immune response and is associated with survival outcomes in patients with ovarian cancer [29,30]. Similar to the findings of a previous study [30], we observed that a lack of CD4+ memory T cell infiltration in the tumor microenvironment was significantly correlated with a worse outcome. The results indicated that tumor infiltration by the T cell population reflected a tumor-related immune response. Thus, reversal of the immunosuppressive tumor microenvironment provides the possibility of adopting immunotherapy strategies for ovarian cancer treatment.
The limitations of our study must be acknowledged. First, our study lacked the experimental data necessary to validate the findings derived from the bioinformatics analyses. Second, the mechanisms underlying the regulation of AADAC expression, as underlined in the comprehensive molecular network, should be further explored. In summary, we identified and validated the correlation between the AADAC expression signature and survival outcome in ovarian cancer, highlighting its potential prognostic value. However, future research is warranted to validate these findings. The AADAC expression was integrated with age, tumor grade, tumor stage, and residual disease in clinical practice based on the model assessment performed herein; consequently, this might promote the stratification of survival prediction in ovarian cancer. Finally, upregulated AADAC expression was correlated with CD4+ T cell infiltration and regulation, processes that participate in the development of adaptive anti-tumor immunity in the ovarian cancer microenvironment, thereby suggesting its potential utility in the prediction of immunotherapy efficacy in ovarian cancer.
In conclusion, the AADAC expression signature was associated with better survival outcome and demonstrated a favorable prognostic potential for ovarian cancer. Overexpressed AADAC correlated with an increased extent of CD4+ memory T cell immune infiltration in the tumor microenvironment. Thus, integration of AADAC expression with feasible clinicopathological parameters has potential clinical value in the prediction of prognosis and immunotherapy efficacy in ovarian cancer.


")