
Introduction
Prediction of labor duration is important for the evaluation and management of pregnancy, and the condition of the cervix, which can be evaluated with various techniques, is crucial for predicting the duration of labor.
The most common evaluation method is the Bishop score, which is determined by manual pelvic examination. The Bishop score is used to decide whether or not to induce labor, and the total score is composed of five components which include cervical dilation, effacement, consistency, position and fetal station. Although this method is the most cost-effective and commonly used, controversy about its accuracy persists [1-6].
Another method of evaluation used to predict preterm delivery is ultrasonographic measurement of the length of the cervix. However, despite its frequent use, many studies have indicated that there is a wide range of cut off values for this procedure, which are less significant for low risk groups [7-9]. Cervical funneling, another widely used ultrasonographic marker, has also had controversial results [10,11]. Both cervical length measurements and the funneling method lack information about cervical ripening and have been shown to be insufficient for predicting labor.
Recently, several studies have claimed that analysis via cervical gray-scale histogram and cervical volume measurement are useful tools for predicting delivery. Although the cervical volume study results remain controversial [12-17], most analysis of the cervical gray-scale histogram has indicated that it is an effective tool [18-22].
A gray-scale histogram of the cervix measures cervical density based on the tissue echogenicity, which indicates cervical consistency. The gray-scale histogram measurements depend on the position and size of the measurement points when performed at a two-dimensional (2D) level. This study analyzed three-dimensional (3D) volumetric gray-scale histograms of the entire cervix and used the differences between the anterior and posterior cervix to increase accuracy. The analysis indicated that the anterior cervix was much more echogenic than the posterior cervix. This is because smaller amounts of the ultrasound beam can pass through the anterior lip of the hard cervix. Thus, there is a greater difference between the anterior and posterior cervical gray-scale histograms than between those of the soft cervix [19]. This study evaluated the volumetric gray-scale histogram difference between the anterior and posterior cervix in order to determine the extent and consistency of the cervix.
The objective of this study was to evaluate the relationship between the number of days to delivery and the volumetric gray-scale histogram value. The study evaluated the ability of the difference between the anterior and posterior cervix to predict cervical consistency and compared these values with current methods that include cervical length, volume and Bishop score.
Materials and methods
This was a prospective study that collected data of 439 patients from September 2010 to October 2011. A total of 34 patients from the Department of Obstetrics and Gynecology at Korea University Ansan Hospital were enrolled in this study, and each patient was 36 to 37 weeks gestational age. Patients that had experienced a Cesarean section, induction of labor or a premature membrane rupture were excluded from this study. Informed consent was obtained from each of the patients, and this study was approved by the Institutional Review Board of the hospital.
The patients underwent cervical evaluation using the Bishop score, cervical length, cervical volume, and a 3D cervical volumetric gray-scale histogram during the 36th to 37th weeks of gestation. Patients were given routine check-ups until delivery, and the study recorded the number of days between the cervical evaluation to the delivery date. The Bishop score was estimated by a single examiner that performed a digital examination. The patients were evaluated by transvaginal ultrasonography in the dorsal lithotomy position with an empty urinary bladder after the pelvic exam. All ultrasound examinations were performed by one experienced sonographer. The transvaginal probe was slowly inserted into the vagina beneath the middle of the cervix, where the cervix was clearly visible, and to avoid distortion of the cervix, no pressure was applied. A sagittal plane of the cervix was identified where the internal os, cervical canal, and the external os were visible. The image was then magnified until the cervix occupied 75% of the monitor screen [23].
The length of the cervix was measured from the external to the internal cervical os, which showed the entire length of the cervix. Measurements were repeated a total of three times, and the mean of the three values was calculated and used for statistical analysis. The study used an ACCUVIX V20 ultrasound system (Samsung Medison, Seoul, Korea), and this device was also used for the 3D analysis.
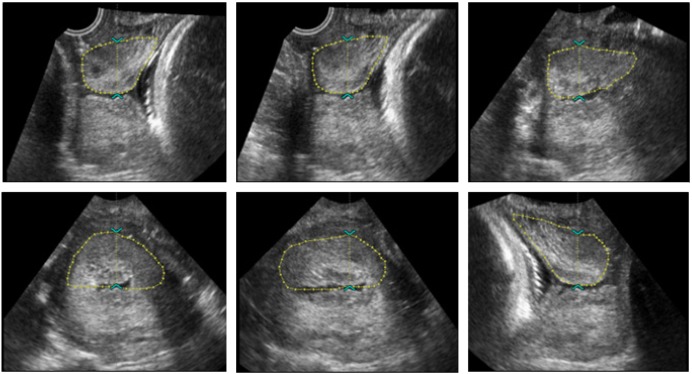
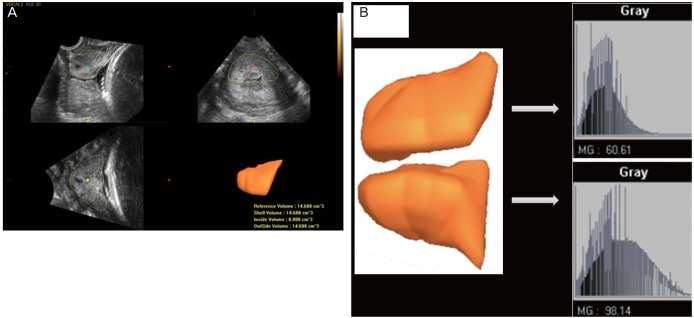
The cervix was centralized in the 3D sector that appeared on the ultrasound screen, and the data were obtained while the transducer was stationary and the crystals were mechanically rotated across the sector with a sweep angle of 90┬░. The fast volume acquisition setting (low resolution) was used to minimize periodic flashing artifacts that could arise from uterine artery pulsation or from fetal movement. The volume was acquired for 15 to 20 seconds, depending on the dimension of the 3D sector. Cervical volume (cm3) was calculated using the Virtual Organ Computer-aided AnaLysis (VOCAL, Samsung Medison), and the anterior lip and posterior lip volumes were acquired. These volumes were manipulated to obtain multi-planar reformatted views of the cervix in the mid-sagittal, axial and coronal planes. All cervical measurements were obtained from the multi-planar images, and the analysis used the VOCAL program manual contour mode. The longitudinal view was used as the reference image, and the rotation steps were performed in increments of 30┬░ so that six contours of the cervix were manually drawn using the roller ball cursor of the system (Fig. 1). The lower uterine segment, the vaginal wall, and especially the large uterine arteries were not included when the contours were drawn; the study used the hyperechogenic or hypoechogenic line between the cervix and the vaginal wall and the internal and external cervical os as landmarks. Once the contours were drawn, the volume and mean gray-scale histogram of the cervix were computed automatically. The mean gray-scale histogram was calculated by dividing the integration of pixels in each bar by the total number of pixels in a 3D region of image (ROI) (Fig. 2). The mean gray-scale histogram, which represented the echogenicity, was calculated at the cervical area of the ROI. The 3D cervical volumetric gray-scale histogram values for the anterior and posterior lip were obtained using the described protocol, and then the difference between the two values was calculated [21,24,25].
The cervical characteristics of nulliparous and multiparous patients were compared (parity Ōēź1). The study identified a correlation between 3D cervical volumetric gray-scale histogram value and days after the cervix evaluation to the time of delivery. We also compared these results with the Bishop score, cervical length, and the volume of the cervix with the number of days after the evaluation to the date of delivery.
The statistical analysis was conducted with SPSS ver. 17.0 (SPSS Inc., Chicago, IL, USA). The data analysis was performed using a Mann-Whitney U test, and categorical variables were analyzed using the Spearman correlation coefficient. A P-value <0.05 was considered to be statistically significant.
Results
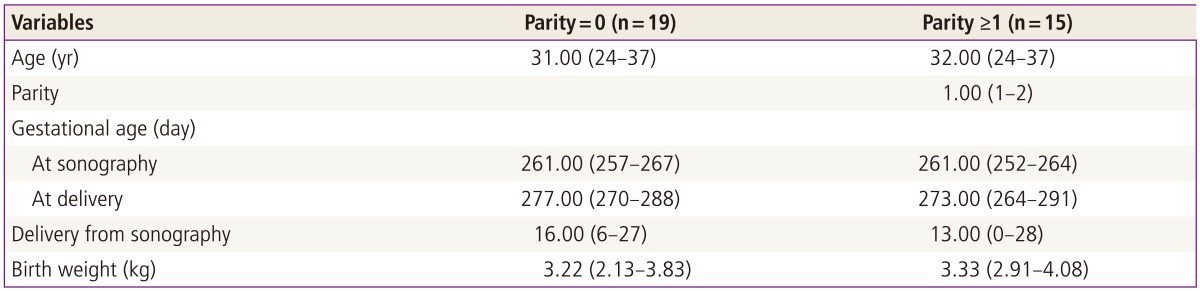
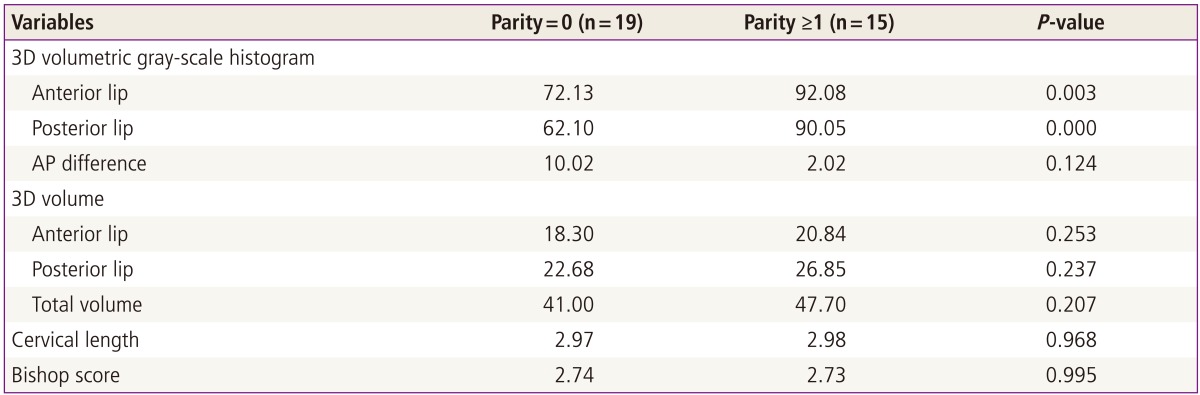
The study evaluated 34 patients, 19 of which were nulliparous and 15 which were multiparous (parity Ōēź1). There were no significant differences in age or obstetric outcomes between the two groups. The median gestational age for both groups was 261 days based on ultrasonographic examination of the cervix, the median gestational age at delivery was 277 days and 273 days for nulliparous and multiparous (parity Ōēź1) patients, respectively, and the median number of days from cervical examination by ultrasonography to delivery (days to delivery) was 16 days for the nulliparous and 13 days for the multiparous groups (Table 1).
The study did not observe any statistically significant differences in total cervical volume, cervical length, or Bishop score based on maternal parity. However, there were significant differences between the nulliparous and multiparous patients when the anterior and posterior lips were examined with the 3D volumetric gray-scale histogram. The results did not indicate a significant difference between the anterior and posterior cervix with the 3D volumetric gray-scale histogram (Table 2).
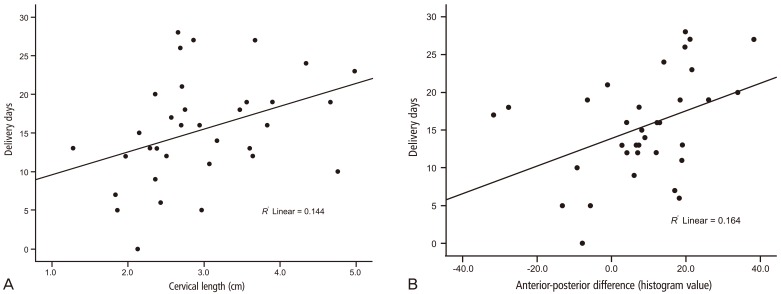
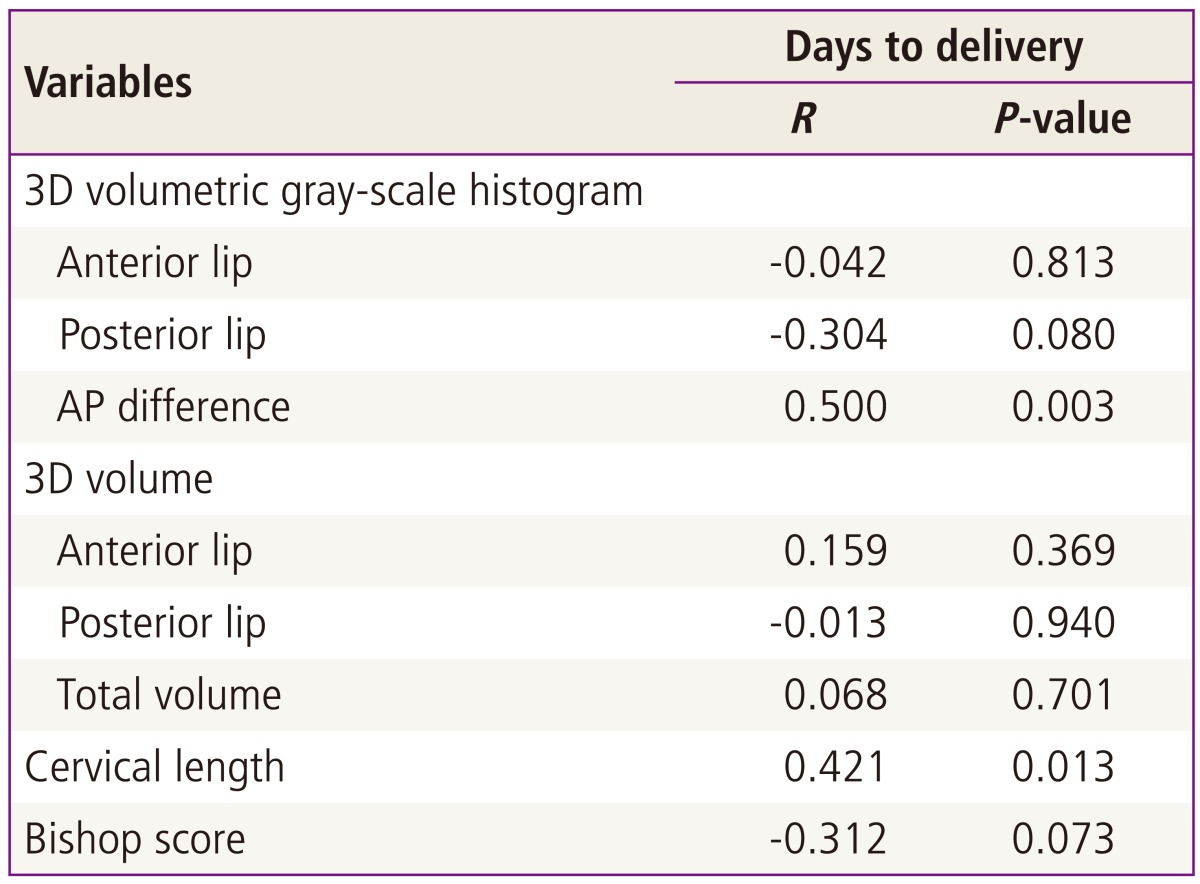
Table 3 shows the results of the bivariate correlation on the association between each cervical factor and the number of days to delivery. The 3D volumetric gray-scale histogram difference between the anterior and posterior cervix was significantly correlated with the number of days to delivery (R = 0.4, P = 0.01) (Fig. 3). Although the R2-value was low, the results indicated that the length of the cervix was significantly related to the time to delivery (R = 0.38, P = 0.02) (Fig. 3). However, the results did not identify an association between anterior lip histogram, posterior lip histogram, anterior lip volume, posterior lip volume, total cervical volume, or Bishop score with the number of days to delivery (Table 3).
Discussion
Due to the risk factors and physiological mechanisms that are related to preterm delivery, new methods that evaluate the condition of the cervix are important for patient care. Currently, new evaluation methods include 2D or 3D ultrasonography, which focuses on the morphologic change of the cervix using cervical volume [12-17] and a gray-scale histogram [18-22].
Cervical consistency is maintained by increased synthesis of collagen, proteins, glycosaminoglycans (GAGs) and fibronectin within the extracellular matrix of the cervix. Biochemical modifications occur during cervical ripening which affect the arrangement of the cervical tissue. These modifications include a marked reduction of collagen concentration, a 2.5-fold increase in the GAG content, a significant decrease in dermatan sulfate concentrations from 41% to 15% of the total GAG content, a 12-fold increase in hyaluronate concentrations, and a marked reduction of fibronectin, all of which have been demonstrated by immunohistochemical experiments. Thus, the loss of collagen and sulfated GAGs may facilitate tension in the ripened cervix, while the significant gain in hyaluronate associated with hydration could explain the soft and swollen consistency of the cervix [20,26].
The graphic representation of the gray-scale histogram illustrates the quantity, reflexivity and disposition of the 'pixels' in the specific area of interest [18]. Although the majority of previous studies measured only the anterior or posterior lips of the cervix or both with a 2D view, a study by Kuwata et al. [19] assessed the differences between the anterior and posterior cervix with a gray-scale histogram. The study determined that a greater positive anterior to posterior value indicated a significantly lower Bishop sub-score for cervical consistency. This result is attributable to the ultrasound beam because, when the beam passes through soft tissue, it indicates low echogenicity. In the soft cervix, the anterior lip allows a greater amount of the ultrasound beam to pass through the tissue, which results in increased echogenicity in the posterior lip. Thus, increased echogenicity of the posterior lip compared with the anterior lip indicates a soft cervix [19].
Previous studies showed that the ultrasound gray-scale histogram can be an objective evaluation method of cervical consistency. However, these studies evaluated the cervix with a 2D level perspective and only evaluated specific parts of the cervix [18,20-22]. Therefore, these measurements may not reflect the entire cervix as 2D measurements may be inaccurate because the images are dependent on the site of observation and may not identify small changes in the tissue. Based on this information, 3D examination is a more objective test and may be more accurate for predicting the time to labor than 2D examination. This study measured the entire cervix in 3D volumes with a cervical gray-scale histogram and is the first study that investigated cervical volume measurement using a volumetric gray-scale histogram for cervical consistency.
The results indicate that the anterior lip volumetric gray-scale histogram and the posterior lip volumetric gray-scale histogram were not significantly associated with the number of days to delivery. However a bivariate analysis indicated that there was a relevant correlation between the volumetric gray-scale histogram difference between the anterior and posterior cervix and the number of days to delivery.
The results demonstrated that greater gray-scale histogram difference between the anterior and posterior cervix was associated with greater number of days to delivery. It was expected that a hard cervix would have a larger gray-scale histogram difference between the anterior and posterior cervix due to the histological changes associated with cervical ripening.
We also evaluated the length of the cervix and the cervical volume to predict the interval of days to delivery. Cervical length is commonly used to predict preterm birth and is significantly associated with preterm delivery [7-9], although numerous studies have indicated varied values for determining delivery. The most commonly used cervical length indicator was less than 25 mm, and the most common preterm birth gestational age was less than 35 weeks [7]. Our study confirmed that the isolated use of the cervical length can also be used as a parameter to predict delivery. Although the R2-value was low and the study did not determine specific cut-off values, the analysis indicated that the cervical length was correlated with the number of days to delivery.
The volume of the cervix changes during the progression of labor, and this change can be determined with 3D measurements of the cervical volume. Many studies have hypothesized that predicting delivery may be possible by measuring the 3D volume of the cervix, but the methods of these studies were variable and produced conflicting results. However, these results could be attributable to the variability of enrolled participants and technical problems with sonography. In addition, demarcation between the cervix and the lower uterine segment was difficult and caused technical problems with sonography. Therefore, studies with a greater number of patients and which measured the entire volume of the cervix had broader implications for patient applications [12-17]. This study did not determine a correlation between the volume of the cervix and the number of days to delivery.
The Bishop score is currently the most commonly used method to determine the amount of time prior to the induction of labor. This score is especially helpful for women that have indications of labor induction. A previous study demonstrated a correlation between the Bishop score and the time of delivery [2]. However, other studies have indicated that the Bishop score is highly subjective, unreliable, and inaccurate because it only classifies the cervix as favorable or unfavorable. In addition, it is difficult to detect minute changes in the cervix or internal os via the Bishop score, and thus there are limitations to accurately predicting the time of delivery [3-5]. This study demonstrated that the Bishop score was not correlated with the number of days to delivery.
This study had several limitations. First, only a small number of women were investigated. Although the results of the gray-scale histogram, which evaluated the difference between the anterior and posterior cervix prior to delivery, were significant, the R2-values were very low, and the study did not obtain significant results in regard to the anterior, posterior or total cervical volume. Additional studies that involve more participants are needed to confirm the present findings. In conclusion, the use of the 3D volumetric gray-scale histogram difference between the anterior and posterior cervix can be used to evaluate the condition of the cervix prior to labor. This technique can be utilized to predict cervical consistency, which can indicate the condition of the cervix for labor and delivery.


")