


Introduction
Maternal malnutrition during pregnancy can adversely affect fetal growth and long-term health outcomes [1,2]. In particular, infants with low birth weight due to malnutrition have a higher risk of obesity and metabolic syndrome (MetS) in later life [3,4]. This concept is known as fetal programming, in which stimuli at the embryonic and fetal stages affect subsequent growth of the offspring and the risk of disease in adulthood [2,5]. In rats, the offspring of 50% food-restricted (FR) dams have low birth weight, subsequent catch-up growth, and adult-onset obesity [6,7]. Similarly, offspring of women exposed to famine were shown to have an increased risk of obesity and MetS in a Dutch Hunger Winter study [8]. The molecular mechanisms by which maternal diet leads to adult diseases are still unknown; however, many studies have reported this association.
Neuropeptides released from the hypothalamus that regulate feeding and metabolism are primarily affected by nutrients and hormone signals [9]. Indeed, adverse intrauterine cues can permanently change in the hypothalamic pro-opiomelanocortin (POMC), neuropeptide Y (NPY), and melanocortin-4 receptor (MC4R) neurons, leading to obesity and MetS in later life [10
11]. POMC is involved in utilizing stored energy and suppressing food intake, while NPY stimulates feeding and energy storage [12]. MC4R is also a key element in the hypothalamic control of short-term and long-term energy homeostasis [13]. For instance, protein restriction of dams during pregnancy results in impaired appetite-regulating pathways, such as POMC and NPY pathways, in neonates [14,15]. Moreover, MC4R plays a critical role in maternal diet-induced obesity in rats [16]. Similarly, disruption of these hypothalamic neurons causes obesity in humans [10]. Leptin, an adipocyte-derived hormone, controls appetite and energy homeostasis by activating POMC/MC4R and inhibiting NPY within the hypothalamus [17]. Leptin administration in leptin-deficient neonatal mice affects hypothalamic POMC and NPY neurons [18].
Epigenetic modification is one of the possible mechanisms underlying the contribution of maternal diet to obesity and MetS in later life [19,20]. Previous studies have shown that alterations in the methylation of POMC and NPY, caused by maternal malnutrition, can lead to obesity and MetS in offspring [21,22,23]. Additionally, rats fed a high-fat diet develop obesity as adults due to effects on the methylation and expression of MC4R [24,25]. Similarly, our previous study showed that POMC methylation in cord blood is associated with lower birth weight and metabolic disturbances in childhood [26]. Most studies have focused on the short-term effects of epigenetic changes in appetite-regulating genes of the offspring on the development of obesity and MetS. Thus, in this study, we aimed to determine whether maternal undernutrition during pregnancy affects the gene expression and DNA methylation of appetite regulators in the hypothalamus of 3-week-old offspring. Additionally, we investigated whether this methylation status at 3 weeks affects the metabolic profiles of the offspring at 3 weeks and 6 months.
Materials and methods
1. Animal model
Eight-week-old male and female Sprague-Dawley rats were purchased from Orient Bio Inc. (Seongnam, Korea). Details of the experimental design have been reported previously [6]. After 1 week of adaptation, the rats were mated and examined for a vaginal plug. At 10 days of gestation, female rats were divided into 2 groups: a control group (n=8), fed a normal diet of standard laboratory chow (Purina, Pyeongtaek, Korea) throughout the pregnancy period and a FR group (n=8), fed a 50% FR diet during pregnancy (Fig. 1). At birth, the litters were culled to 10 pups/dam and were weaned at 21 days of age. The offspring were sacrificed at 3 weeks (9 males/9 females) and 6 months of age (8 males/8 females). After weighing, the hypothalamus and blood samples were obtained. Body weight and food intake were measured 3 days per week until 6 months of age.
Fig.┬Ā1
Experimental design. Eight-week-old male and female Sprague-Dawley (SD) rats (n=8/group) were used in this study. At day 10 of gestation, pregnant SD rats were divided into 2 groups: 1) a control group, fed a normal diet throughout the whole experimental period and 2) a food-restriction (FR) group, fed a 50% FR diet during pregnancy and a normal diet after delivery.

2. Measurement of metabolic parameters
To assess changes in metabolic parameters at 2 time points (3 weeks and 6 months of age), the offspring of each group were fasted overnight, and blood was collected via cardiac puncture into heparinized tubes after rapid decapitation. Plasma glucose, triglyceride (TG), total cholesterol (TC), high-density lipoprotein cholesterol (HDL-C), and low-density lipoprotein cholesterol (LDL-C) levels were analyzed by an enzymatic colorimetric method using a Cobas 8000 instrument (Roche Diagnostics GmbH, Mannheim, Germany). Insulin and leptin levels were also assayed using a rat insulin enzyme-linked immunosorbent assay (ELISA) kit (Alpco, Salem, NH, USA) and a leptin ELISA kit (BioVendor, Modrice, Czech Republic), respectively, according to the manufacturers' instructions.
3. DNA methylation analysis by pyrosequencing
Genomic DNA was extracted from hypothalamus tissues of 3-week-old offspring (n=8) using a DNeasy Blood and Tissue Kit (Qiagen, Hilden, Germany) and was modified by sodium bisulfite using the EZ DNA Methylation kit (Zymo Research, Irvine, CA, USA) according to the manufacturers' protocols. The methods used for pyrosequencing analysis have been reported previously [26,27]. Pyrosequencing primers were designed by PSQ Assay Design software (Biotage AB, Uppsala, Sweden), using data from previous studies to search cytosine-phosphate-guanine (CpG) islands in promoter regions [24,28] (Supplementary Table 1). The CpG sites of each gene are as follows: POMC (ŌłÆ166, ŌłÆ164, ŌłÆ156, and ŌłÆ152 bp upstream of the transcription start site [TSS]), NPY (region I: ŌłÆ464, ŌłÆ459, ŌłÆ445, and ŌłÆ439 bp and region II: ŌłÆ167, ŌłÆ164, ŌłÆ157, and ŌłÆ153 bp upstream of the TSS), and MC4R (region I: +62 and +64 bp and region II: +288 and +282 bp downstream of the TSS).
4. Quantitative polymerase chain reaction (PCR)
Total RNA was isolated from the hypothalamus tissues of 3-week-old offspring (n=8) using TRIzol Reagent (Invitrogen, Carlsbad, CA, USA) according to the manufacturer's instructions. To convert RNA to cDNA, reverse transcription was performed using SuperScript III reverse transcriptase (Invitrogen) in a 25-μL reaction volume containing 1 μg of RNA. Quantitative PCR was performed in a 20-μL reaction mixture containing cDNA, SYBR Premix EX Taq (Takara Bio, Shiga, Japan), and primers for each gene (Supplementary Table 2), using an ABI PRISM 7000 sequence detection system (Applied BioSystems, Foster City, CA, USA). The reactions were performed at 95°C for 10 minutes, followed by 40 cycles of 95°C for 15 seconds and 63°C for 1 minutes and a dissociation step of 1 cycle of 95°C for 15 seconds, 63°C for 20 seconds, and 95°C for 15 seconds. Comparative quantitation of each target gene was performed using the cycle threshold (CT) method, with normalization against the CT of glyceraldehyde 3-phosphate dehydrogenase to calculate ΔΔCT.
5. Western blotting analysis
The hypothalamus tissues of 3-week-old offspring (n=8) were homogenized in RIPA buffer (Biosesang, Seongnam, Korea) with a protease inhibitor cocktail (Roche, Mannheim, Germany). Protein concentration was determined using a bicinchoninic acid protein assay kit (Thermo Scientific, Rockford, IL, USA). Forty micrograms of protein were separated on an 8% sodium dodecyl sulfate-polyacrylamide gel and then transferred to a nitrocellulose membrane. The membrane was blocked for 1 hour in 5% skim milk in Tris-buffered saline with 0.01% tween-20 (TBS-T). After being washed, the membrane was incubated at 4┬░C overnight with an anti-POMC (1:1,000; Phoenix, Belmont, CA, USA), anti-NPY (1:1,000; Santa Cruz Biotechnology, Santa Cruz, CA, USA), anti-MC4R (1:1,000; Abcam, Cambridge, UK), or anti-beta-actin (1:3,000; Santa Cruz Biotechnology) antibody. The blot was then probed with the corresponding secondary antibody. The bands were visualized using enhanced chemiluminescence reagents (Amersham Pharmacia Biotech, Piscataway, NJ, USA) and densitometric analysis using ImageQuant software.
6. Statistical analysis
Data are presented as mean┬▒standard deviation and were analyzed using a Student's t-test. Pearson's correlation analysis was performed to access the relationship between DNA methylation status at 3 weeks and metabolic profiles in 3-week- and 6-month-old offspring. Statistical analyses were performed with SPSS 24.0 software (IBM, Armonk, NY, USA). All analyses were 2-tailed, and P<0.05 was considered to indicate statistical significance.
Results
1. Birth weight and metabolic profiles
Body weight at birth was significantly lower in offspring of the FR group than offspring of the control group (FR, 6.85 vs. control, 7.64 g), but rapid catch-up growth was seen, in male offspring only, after 3 weeks. In 3-week-old offspring, levels of TC, TG, and LDL-C in both males and females were significantly higher in the FR group than in the control group (P<0.05). In addition, HDL-C levels were significantly higher in females of the FR group (P<0.01). After 6 months, the body weights of both male and female offspring were significantly higher in the FR group than the control group (P<0.05). In males, glucose, TG, HDL-C, LDL-C, and leptin levels were significantly higher in the FR group than the control group (P<0.05). On the contrary, in females, only TG and leptin levels were markedly higher in the FR group compared with the control group (P<0.01) (Table 1).
Table┬Ā1
Body weight and metabolic profiles in the offspring of the control and FR group
Values are given as means┬▒standard deviation. P-values were analyzed using a Student's t-test.
FR, food restriction; TC, total cholesterol; TG, triglyceride; HDL-C, high-density lipoprotein cholesterol; LDL-C, low-density lipoprotein cholesterol.
2. POMC, NPY, and MC4R gene expression of in the hypothalamus of 3-week-old offspring
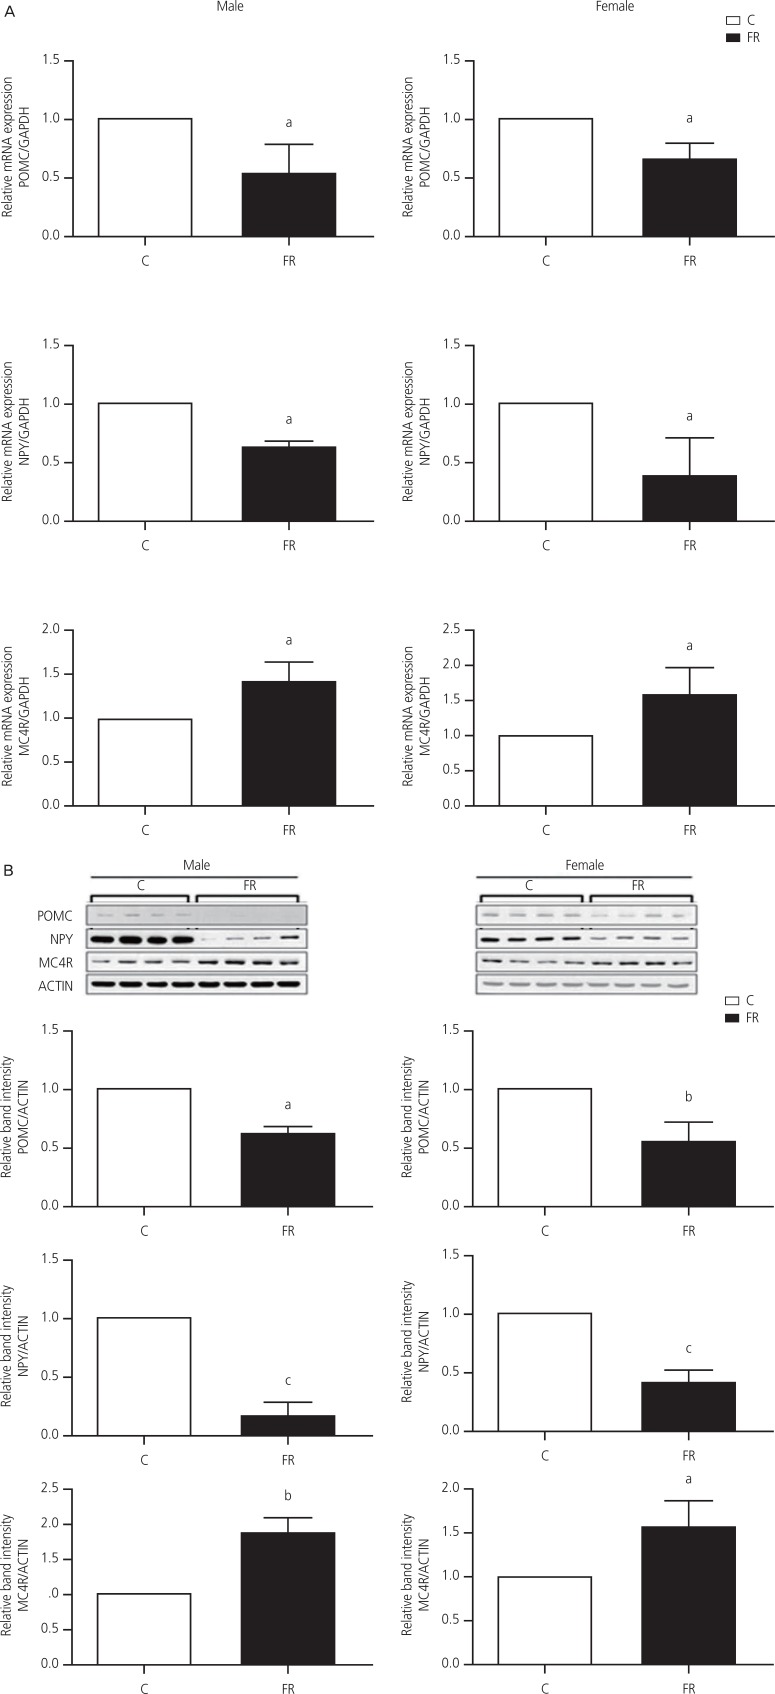
In both male and female offspring, the mRNA expression of POMC and NPY showed a significant decrease in the FR group compared with the control group (P<0.05). Similarly, the protein expression levels of POMC and NPY were significantly lower in the FR group (P<0.05). However, the mRNA and protein expression levels of MC4R were significantly increased in the FR group compared to the control group (P<0.05, Fig. 2).
Fig.┬Ā2
Relative mRNA and protein expression levels of pro-opiomelanocortin (POMC), neuropeptide Y (NPY), and melanocortin 4 receptor (MC4R) in the hypothalamus of 3-week-old offspring. (A) The mRNA expression levels of POMC, NPY, and MC4R were analyzed using real-time PCR in the food-restricted (FR) and control (C) groups (n=9 males, 9 females/group). Data are presented as means┬▒standard deviation (SD). (B) The protein expression levels of POMC, NPY, and MC4R were analyzed using western blotting in the FR and C groups (n=9 males, 9 females/group). Data are presented as means┬▒SD.
GAPDH, glyceraldehyde 3-phosphate dehydrogenase.
a)P<0.05; b)P<0.01; c)P<0.001.
3. POMC, NPY, and MC4R methylation in the hypothalamus of 3-week-old offspring
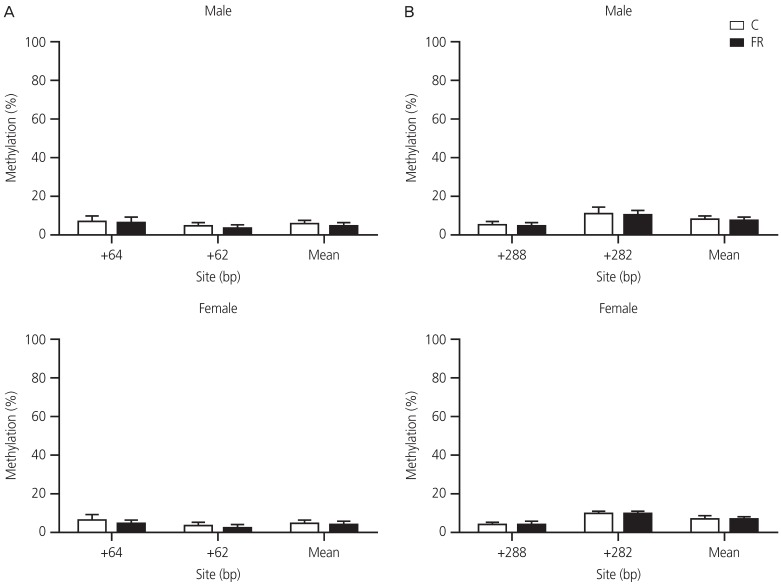
POMC was significantly hypermethylated at CpG1 and showed high mean CpG methylation levels in males of the FR group (P<0.05), but not in females (Fig. 3). However, different POMC CpG sites showed similar patterns of methylation between the 2 groups. In contrast, NPY and MC4R showed relatively low methylation levels in both groups (Figs. 4 and 5). Thus, we focused on mean methylation levels across all POMC CpG sites in male offspring, which showed a significant difference (P<0.05).
Fig.┬Ā3
Hypothalamic pro-opiomelanocortin (POMC) methylation in male (A) and female (B) offspring at 3 weeks of age (n=9 males, 9 females/group). POMC methylation was measured by pyrosequencing in offspring of the food-restricted (FR) and control (C) dams. Data are presented as means┬▒standard deviation.
a)P<0.05.
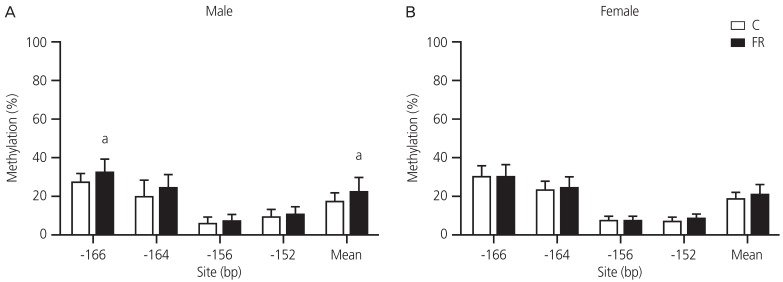
Fig.┬Ā4
Hypothalamic neuropeptide Y (NPY) methylation in male and female offspring at 3 weeks of age (n=9 males, 9 females/group). (A) Methylation of promoter region 1 and (B) promoter region 2 of the NPY gene. Data are presented as means┬▒standard deviation.
C, control; FR, food-restricted.
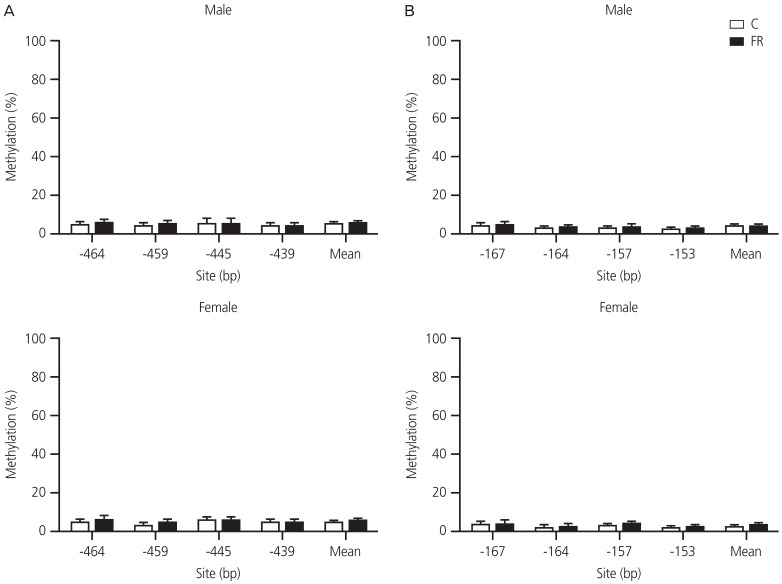
Fig.┬Ā5
Hypothalamic melanocortin-4 receptor (MC4R) methylation in male and female offspring at 3 weeks of age (n=9 males, 9 females/group). (A) DNA methylation of promoter region 1 in and (B) promoter region 2 of the MC4R gene. Values are presented as means┬▒standard deviation.
C, control; FR, food-restricted.
4. The relationship between POMC methylation and metabolic profiles
To evaluate the short- and long-term effects of DNA methylation on metabolic indices, we analyzed the relationship between POMC methylation at 3 weeks and metabolic profiles, which were sampled at 2 time points, i.e., 3 weeks (short-term) and 6 months (long-term) of age, in male offspring (Table 2). Interestingly, there was a significant correlation between lower birth weights and POMC methylation (r=ŌłÆ0.56, P=0.04). At 3 weeks, hypermethylation of POMC showed a significant correlation with higher levels of HDL-C and LDL-C in male offspring (r=0.78, P=0.02; r=0.85, P=0.02, respectively). Furthermore, the hypermethylation status of POMC at 3 weeks showed a strong positive correlation with TG, LDL-C, and leptin levels in 6-month-old male offspring (r=0.72, P<0.05; r=0.76, P<0.05; r=0.71, P<0.05, respectively).
Table┬Ā2
The relationship between POMC methylation at 3 weeks and metabolic profiles at 3 weeks and 6 months-old male offspring
P-values obtained from Pearson correlation analysis.
POMC, pro-opiomelanocortin; TC, total cholesterol; TG, triglyceride, HDL-C, high-density lipoproteins cholesterol; LDL-C, low-density lipoproteins cholesterol.
Discussion
Using a 50% FR rat model, we explored the effect of epigenetic changes in hypothalamic appetite-regulator genes, caused by maternal diet, on the metabolic phenotypes of their offspring. In this study, maternal undernutrition affected the expression of POMC, NPY, and MC4R in 3-week-old offspring. In particular, POMC methylation was significantly correlated with LDL-C levels in 3-week- and 6-month-old male offspring. These findings suggest that epigenetic changes in appetite-regulated genes induced in early life can persistently influence metabolic profiles in later life.
Epidemiological and animal studies have revealed a close link between intrauterine growth restriction (IUGR) induced by maternal diet and obesity and MetS [3,4,7]. At 3 weeks of age, we observed that the offspring of FR dams showed IUGR, followed by catch-up growth and increased TC, TG, and LDL-C levels. Similar findings have been described by Nowacka-Woszuk et al. [29], who reported that rat offspring of calorie-restricted dams had a significant increase in LDL-C at 4 weeks of age, although their body composition did not differ significantly from control rats. At 6 months of age, we found that the offspring of FR dams were significantly heavier and had increased TG and leptin levels. Desai et al. [7,30] demonstrated that TG and leptin levels were markedly higher in rat offspring of FR dams at 9 months of age, than in offspring of control dams, although their TG levels were lower at 3 weeks. In addition, rat offspring of malnourished dams show a significant increase in leptin levels at 125 days [31]. In humans, exposure to the Dutch famine caused higher levels of TC, LDL-C, and LDL-C/HDL-C, thereby increasing the risk of MetS [8]. Thus, we speculated that these changes in lipid profiles were associated with key genes/pathways of appetite and metabolism [32].
Next, we investigated whether the maternal diet affected hypothalamic appetite-related genes at 3 weeks of age through epigenetic mechanisms. Our results revealed that the expression levels of POMC, NPY, and MC4R were altered in 3-week-old offspring of FR dams. Among these genes, POMC methylation was significantly different between the 2 groups. Additionally, POMC methylation was negatively correlated with the mRNA expression of POMC. Consistent with our results, Plagemann et al. [28] previously demonstrated that neonatal overfeeding leads to increased POMC methylation and decreased NPY methylation in FR rats. In rats, offspring from protein-restricted dams exhibit increased POMC methylation and decreased mRNA expression of POMC and NPY in early postnatal life [33]. Conversely, hypomethylation and an increase in POMC expression in the hypothalamus have been observed in undernourished sheep [34]. In humans, hypermethylation of POMC in blood has been found to be associated with childhood obesity [35]. This discrepancy may be due to differences in the species and target tissues studied. Based on these results, we suggest that a lack of nutrients during pregnancy affects appetite signaling in the hypothalamus, due to changes in DNA methylation, leading to adult obesity and MetS.
We further examined whether POMC methylation caused by maternal diet affected short- and long-term health outcomes. This study focused on male offspring, which showed significant differences in POMC methylation between the 2 groups. First, we identified the short-term effect of DNA methylation on metabolic profiles by confirming the significant correlation between the hypermethylation of POMC and HDL-C and LDL-C levels at 3 weeks of age. Our previous studies have demonstrated that hypermethylation of POMC is significantly associated with HDL-C levels in children [26,27]. Tung et al. [36] reported that POMC and MC4R neurons in the hypothalamus regulate HDL-c levels. Furthermore, a POMC mutation has been associated with higher LDL-C levels in adolescents [37]. Next, we investigated the long-term effect of DNA methylation on metabolic profiles by confirming the strong positive correlation between POMC methylation at 3 weeks of age and TG, LDL-C, and leptin levels at 6 months of age. Our earlier study reported that hypermethylation of POMC at birth is significantly associated with higher TG levels in children [26]. In addition, Plagemann et al. [28] found that hypermethylation of POMC due to early overfeeding causes hyperleptinemia in rats. In contrast, a high-fat and high-sucrose diet leads to hypomethylation of POMC and higher leptin levels in mice [38]. This discrepancy may be due to differences in the composition of the diet and the period of feeding. Collectively, our data suggest that altered POMC methylation in male offspring may contribute to the development of MetS in the offspring in later life. Further follow-up studies of adults born under conditions of FR are needed to verify the long-term impact of altered POMC methylation.
This study demonstrated that altered methylation and expression of the POMC gene, induced by maternal undernutrition, can lead to changes in the metabolic profiles of male offspring. These changes in early life may directly contribute to obesity and MetS, although the difference in methylation levels is small. Furthermore, our previous study demonstrated that POMC methylation status can be stably maintained from birth to childhood [26]. Therefore, we conclude that POMC methylation, caused by maternal diet, can persistently affect appetite regulation and the development of MetS in offspring in later life. However, follow-up studies are needed to verify this conclusion.


")