Delayed diagnosis of gestational diabetes mellitus and perinatal outcomes in women with large for gestational age fetuses during the third trimester
Article information

Abstract
Objective
We evaluated the incidence of newly diagnosed gestational diabetes mellitus (GDM) during the 3rd trimester in women with suspected large for gestational age (LGA) fetuses on ultrasound and assessed their perinatal outcomes.
Methods
A retrospective cohort study was performed. Singleton pregnant women with suspected LGA on the 3rd trimester ultrasound and whose results of GDM screening at midpregnancy had been normal were enrolled. All participants were retested with 100-g oral glucose tolerance test (OGTT) within 2 days after diagnosis of LGA. We compared perinatal outcomes between the newly diagnosed with GDM group and the non-GDM group.
Results
Among 169 pregnant women, 13% (23/169) were newly diagnosed with GDM. The women in the GDM group had a higher HbA1c level at diagnosis (5.8 vs. 5.3, P<0.01) and earlier gestational age at delivery (38.0 vs 38.9 weeks of gestation, P=0.003) than those in the non-GDM group. The rate of cesarean delivery (CD) was significantly higher in the GDM group than that in the non-GDM group (73.9%, vs. 49.3%, P=0.028) with similar proportions for the indications of CD except CD on maternal request (CDMR). The CDMR rate was higher in the GDM group than non-GDM group (41.2% vs. 23.6%) but it did not reach statistical significance. There were no significant differences in the obstetrical and neonatal complications between the two groups.
Conclusion
Among pregnant women with suspected LGA, 13% were newly diagnosed with GDM in late pregnancy. Nonetheless, there were no differences in the perinatal outcomes between women with newly diagnosed GDM and those without GDM. However, concerns over shoulder dystocia appear to increase CD rates in the GDM group.
Introduction
As gestational age progresses and the placenta increases in size, the levels of pregnancy-associated hormones secreted from the placenta such as estrogen, progesterone, cortisol, and placental lactogen also increase. In particular, the secretion of human placenta lactogen (hPL) increases approximately 10-fold in the second half of pregnancy. hPL, which is a potent antagonist of insulin action, induces fasting hypoglycemia, postprandial hyperglycemia and hyperinsulinemia physiologically in pregnant women by promoting lypolysis and increasing free fatty acid in maternal serum to conserve glucose for fetal growth [1]. As the pregnancy progresses, insulin sensitivity begins to decrease, and insulin resistance increases by hormones secreted in the placenta during the pregnancy [2]. As a result, the risk of diabetes increases theoretically in the latter half of pregnancy.
Gestational diabetes mellitus (GDM) is known to induce complications for both mother and fetus. Maternal complications include gestational hypertensive disease, risk of cesarean delivery (CD), future development of type 2 diabetes mellitus (DM), cardiovascular disease and metabolic syndrome [3-7]. If glucose control is poor in women with GDM, the risk of unexplained stillbirth may be similar to that of pregnant women with pregestational DM [8,9]. Neonatal hypoglycemia, hyperinsulinemia, and risk of macrosomia can develop in neonates of women with GDM [10,11].
GDM is known as a leading cause of excessive fetal growth. Large for gestational age (LGA) is defined as birth weight above the 90th percentile for gestational age [12]. Mothers with diabetes, either GDM or pregestational DM, have a 3-fold higher rate of LGA than women with normal range blood glycemic control, with 15–45% of all cases of LGA [13]. A high concentration of glucose in maternal serum is delivered to the fetus through the placenta, which results in fetal hyperglycemia. Then, insulin secretion is increased in the fetus to synthesize lipid and glycogen from blood glucose, resulting in excessive accumulation of fat in the shoulder and middle of the body and increased body weight of fetus. LGA can lead to complications for both mother and infant, it increases the risk of shoulder dystocia, clavicle fracture, brachial plexus injury, and neonatal intensive care unit admission rate. In the mother, it increases the rate of CD, vaginal laceration, and postpartum hemorrhage [10,11].
Most pregnant women undergo an oral glucose tolerance test (OGTT) between 24 and 28 weeks of gestation. If they are diagnosed with GDM, blood glucose control will be necessary throughout the pregnancy for prevention of complications. However, LGA is sometimes suspected on the ultrasound in late pregnancy in women with normal routine blood glucose test results at 24–28 weeks of gestation. There are a few studies about maternal glucose intolerance in the 3rd trimester. One prospective study evaluated the incidence of abnormal 75-g OGTT results and their perinatal outcomes in previously normoglycemic pregnant women during the 3rd trimester [14]. It showed that the incidence was 13.5% and there was no increased risk of perinatal outcomes. However, there has been no previous study about delayed diagnosis of GDM in women with LGA fetuses during the 3rd trimester. We focused on pregnant women with suspected LGA on the 3rd trimester ultrasound but whose previous routine glucose testing had been normal between 24 and 28 weeks of gestation. This study was performed to evaluate the incidence of newly diagnosed GDM in the 3rd trimester of pregnancy and the perinatal outcome in these women.
Materials and methods
1. Study design
A retrospective cohort study was performed. Among singleton pregnant women who delivered at Seoul Metropolitan Government-Seoul National University Boramae Medical Center from January 2010 to December 2018, women who were retested for an OGTT because of suspected LGA on ultrasound in the 3rd trimester were enrolled. Their results of GDM screening at 24–28 weeks of gestation had been normal. Women with pre-gestational DM, GDM already diagnosed or no glucose testing during the 2nd trimester, twin pregnancy, or fetal congenital malformations were excluded.
Routine blood glucose testing at 24–28 weeks of gestations was performed using a 2-step process: 50-g oral glucose challenge test (GCT), followed by a 100-g OGTT for abnormal result in the 50-g GCT (>140 mg/dL). Interpretation of the diagnostic 100-g OGTT followed the Carpenter-Coustan criteria. The reference values were as follows: fasting, 95 mg/dL; 1-hour, 180 mg/dL; 2-hour, 155 mg/dL; 3-hour, and 140 mg/dL; 2 or more of the plasma glucose concentrations are met or exceeded for a positive diagnosis [15]. The test was performed in the morning after an overnight fasting over 8 hours, with the women remaining seated and at rest. Estimated fetal weight (EFW) was calculated by the Hadlock formula using ultrasonography, and LGA was defined as EFW more than 90th percentile for gestational age. We used the reference of percentile distributions of birth weight according to gestational ages in Korea [16]. If an LGA fetus was suspected during the 3rd trimester, the 100-g OGTT was retested same as routine manual within 2 days after diagnosis of LGA on ultrasound. If women were newly diagnosed with GDM, they started diet control and checked blood sugar levels unless delivery was imminent.
We compared the incidence of CD, obstetrical complications (gestational hypertensive disease, preterm birth, and shoulder dystocia), and neonatal complications (neonatal intensive care unit [NICU] admission and neonatal hypoglycemia) between the newly diagnosed with GDM group and the non-GDM group.
This study was approved by the Institutional Review Board of the Seoul Metropolitan Government-Seoul National University Boramae Medical Center (IRB No. 30-2019-111).
2. Statistical analyses
For statistical analysis, comparison of the proportions was performed using Pearson’s χ2 test or Fisher’s exact test. Continuous variables were compared using the Mann-Whitney U test. Logistic regression analysis was used to evaluate the relationship between the presence or absence of GDM and the pregnancy outcomes of interest after adjustment for gestational age. P-value <0.05 was considered statistically significant. International Business Machines (IBM) Statistical Package for the Social Sciences (SPSS) statistics software ver. 20.0 (IBM Corp., Armonk, NY, USA) was used for data analysis.
Results
Of 169 pregnant women who were retested using the 100-g OGTT, 13% (23/169) were newly diagnosed with GDM. There were no significant differences in the maternal age, parity, pre-pregnancy body mass index, family history of DM, gestational age at OGTT, and fetal sex between the newly diagnosed with GDM group and the non-GDM group. The women in the GDM group had higher level of HbA1c at diagnosis (5.8 vs 5.3, P<0.01) and earlier gestational age at delivery than those in the non-GDM group (38.0 vs. 38.9 weeks of gestation, P=0.003), but birth weight was not significantly different between the two groups (3,512 g vs. 3,603 g, P=0.360) after adjustment for gestational age at delivery (P=0.548). There were no significant differences in incidence of obstetrical complications (gestational hypertensive disease, preterm birth, and shoulder dystocia) and neonatal complications (NICU admission and neonatal hypoglycemia) between the two groups. Tables 1 and 2 show maternal, neonatal characteristics, and perinatal outcomes.

Maternal characteristics
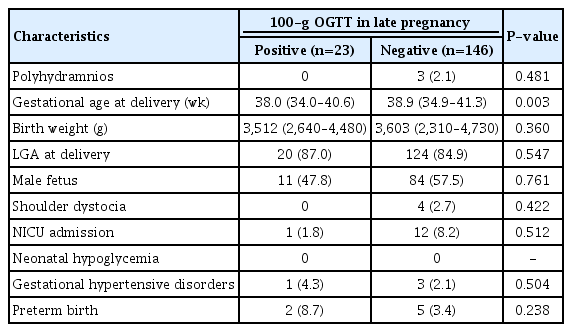
Neonatal characteristics and perinatal outcomes according to the diagnosis of gestational diabetes mellitus in late pregnancy
The results of routine blood glucose testing at 24–28 weeks of gestation are described in Table 3. The values of the 50-g GCT were similar in both groups. If the result of 50-g GCT was above the cutoff value, the 100-g OGTT was performed. The profiles of the 100-g OGTT results were also similar between the groups, but the 2-hour value was significantly higher in women diagnosed with GDM (156 vs. 128, P=0.018).
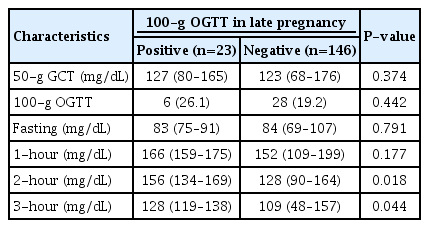
Results of previous routine blood glucose testing between 24 and 28 weeks of gestation according to the subsequent diagnosis of gestational diabetes mellitus in late pregnancy
Table 4 demonstrates the results of retested 100-g OGTT after identifying excessive fetal growth on the 3rd trimester ultrasound. The gestational age and EFW on ultrasound at the time of 100-g OGTT were not significantly different between the two groups. In the GDM group, 17.4%, 73.9%, 78.3% and 56.5% of patients revealed abnormal serum glucose level in fasting, 1-hour, 2-hour, and 3-hour values in 100-g OGTT, respectively.
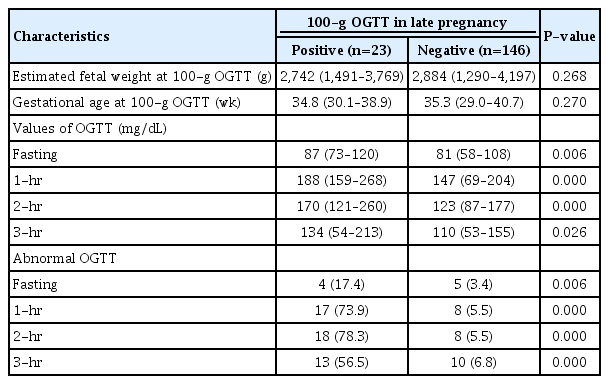
Results of retested 100-g oral glucose tolerance test (OGTT) after identifying excessive fetal growth during the 3rd trimester ultrasound
The characteristics of the delivery mode are shown in Table 5. The rate of trial of labor was significantly lower in the GDM group than that in the non-GDM group (39.1% vs 71.2%, P=0.002). The rate of CD in the GDM group was significantly higher than that in the non-GDM group (73.9% vs. 49.3%, P=0.028). When we analyzed the indication for CD, the proportions of indications were similar in both groups, except CD on maternal request (CDMR). The rate of CDMR without any obstetrical indication was higher in the GDM than that in the non-GDM group (41.2% vs. 23.6%), but it could not reach statistical significance. The distribution of other indications for CD was similar between the two groups.
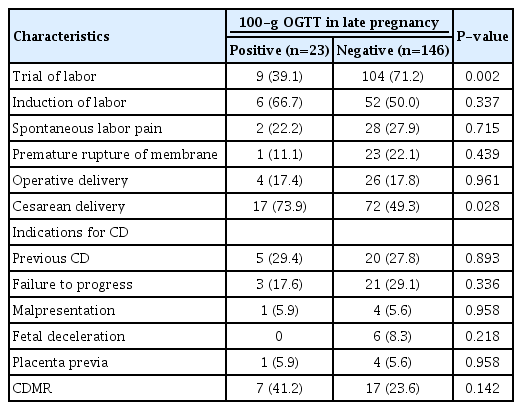
Characteristics of delivery mode in both groups
After delivery, we conducted a postpartum 75-g OGTT in women diagnosed with GDM. None of the women were diagnosed with DM and only one had impaired glucose tolerance (fasting 112 mg/dL, 2-hour 187 mg/dL).
Discussion
This is the first study to analyze the incidence of newly diagnosed GDM and perinatal outcomes in previously normoglycemic pregnant women with suspected LGA fetuses in the 3rd trimester.
While showing normal results in routine blood glucose test at mid-pregnancy, 13% of pregnant women with suspected LGA fetuses in the 3rd trimester of pregnancy were newly diagnosed with GDM. Nonetheless, there were no differences in the perinatal outcomes between the newly diagnosed GDM group and the non-GDM group. However, concerns over complications of GDM, such as shoulder dystocia, appear to increase CD.
Because GDM is the main cause of fetal excessive growth and insulin resistance increases as gestational age progresses, newly developed GDM can be considered in pregnant woman when EFW is large for gestational age in the 3rd trimester, even if their previous GDM screening at 24–28 weeks of gestation had been normal. After diagnosis of GDM, even if in late pregnancy, pregnant women used to control their blood sugar levels to prevent obstetric and perinatal complications associated with GDM. A previous study showed that patients diagnosed with GDM during the 3rd trimester had infants with lower birthweight than those of non-diabetics or those with a single pathological value of GTT. Glucose control in women with late-onset GDM may lead to lower birthweights, and there was no difference in CD rate and neonatal outcomes after adjustment for potential confounders in one study [17].
In our study, about 13% of participants were newly diagnosed with GDM in late pregnancy. Generally, the more advanced the gestational age, the higher the possibility of GDM development because of increasing insulin resistance with the growing placenta volume. Therefore, there were several previous studies to evaluate the relationship between abnormal blood glucose levels during the 3rd trimester and perinatal outcomes in previously normoglycemic pregnant women. In one study, the incidence of newly developed GDM and glucose intolerance, which was diagnosed when satisfying only one abnormal value of four blood glucose levels in 100-g OGTT, was 4.3% and 9.9%, respectively [17]. In another study, 486 high-risk pregnant women were retested for GDM after 32 weeks of gestation, and 4.7% were newly diagnosed with GDM [18]. The authors called it late-onset GDM. There was a study reporting that 6.7% of 404 women were diagnosed with GDM in the 3rd trimester [19]. The incidence of newly diagnosed GDM during the 3rd trimester varied among the previous studies but was lower than that in our study (13%). This is probably because we enrolled only pregnant women with LGA fetuses, who are likely to have GDM. Retesting GDM in pregnant women with LGA fetuses during the 3rd trimester seems to be meaningful because they are more likely to have GDM than normal pregnant women. A previous study showed an incidence of newly diagnosed GDM during the 3rd trimester similar to our result [14]. However, our study differs from the previous study in two aspects, study population and diagnostic method. We enrolled only pregnant women with LGA fetuses in the 3rd trimester, who were at high risk of GDM, and we used a 100-g GTT following Carpenter-Coustan criteria as a diagnostic test, unlike their 75-g OGTT.
Gestational age at delivery was significantly earlier in the GDM group than non-GDM group (38.0 vs. 38.9 weeks of gestation, P=0.003) in our study. This is presumed to be a result of earlier intervention considering maternal and fetal complications of GDM. The median value of birth weight has no statistical difference between the two groups after adjusting for gestational age. After GDM diagnosis, it is expected that the occurrence of GDM-related complications, including LGA, will be reduced because those women will start to control their diet and monitor their blood sugar levels [20]. There were no differences in other perinatal outcomes between the newly diagnosed GDM group and non-GDM group in this study. The intervention performed after the diagnosis of GDM in the GDM group may have affected the perinatal outcomes.
From the aspect of delivery mode, the rate of trial of labor was significantly higher in the non-GDM than in the GDM group. Conversely, CD was more often performed in the GDM group. These results may be due to concerns over complications of GDM, such as shoulder dystocia, caused by LGA in the GDM group. The rate of CDMR was particularly higher in the GDM group, although the difference did not reach statistical significance.
We usually do not test the HbA1c value when a routine blood glucose test is conducted during the 2nd trimester if not indicated. In our study, the HbA1c value measured during the 3rd trimester was significantly higher in the newly diagnosed GDM group than non-GDM group (5.8 vs 5.3, P≤0.05). HbA1c is a standard method for assessing long-term glucose control over the previous several weeks, about 2–3 months [21]. If HbA1c is requested during the 2nd trimester and screened together at the time of blood glucose testing, it may be useful to predict future development of GDM even if the results did not reach the diagnostic threshold for the GDM at that time of routine blood glucose testing. HbA1c can be a more precise tool than OGTT to evaluate glucose metabolism by reflecting long-term blood glucose control. However, in order to apply this protocol to actual practice, it is required to evaluate the cost-effectiveness of this additional test.
GDM can affect not only the current but also the next pregnancy. History of GDM corresponds to the high-risk group according to the GDM risk assessment by criteria of the Fifth International Workshop-Conference on Gestational Diabetes. It is recommended that these pregnant women take the test for GDM as soon as possible after diagnosis of their next pregnancy [22]. This will enable timely GDM screening at the next pregnancy, and adequate management according to the results may improve the pregnancy outcome because women with a history of GDM have risk of developing GDM during early pregnancy, which can be associated with poor pregnancy outcome compatible with pregestational DM. Moreover, there is a 50% likelihood of women with GDM developing overt diabetes within 20 years [23]. Thus, it can provide important information on their future health care.
This study had some limitations. It was a retrospective study, and a number of pregnant women with LGA fetuses could not be enrolled because they had not been retested for GDM during the 3rd trimester. We have plans for prospective studies to enroll more pregnant women with LGA fetuses during the 3rd trimester. In addition, we want to evaluate the relationship between HbA1c at the time of routine blood glucose testing at 24–28 weeks of gestation and future development of LGA fetuses during the 3rd trimester.
In conclusion, the rate of newly diagnosed GDM was 13% in pregnant women with suspicious excessive fetal growth in the 3rd trimester of pregnancy. Nonetheless, there were no differences in the perinatal outcomes between women with newly diagnosed GDM and those without GDM. However, concerns over complications of GDM, such as shoulder dystocia, appear to increase the rate of CD.
Acknowledgements
This work was supported by the Basic Science Program through the National Research Foundation of Korea (NRF) funded by the Ministry of Education (NRF-2017R1D1A1B03029883).
Notes
Conflict of interest
No potential conflict of interest relevant to this article was reported.
Ethical approval
This study was approved by the Institutional Review Board of the Seoul Metropolitan Government-Seoul National University Boramae Medical Center (IRB no. 30-2019-111).