Clinical significance of soft markers in second trimester ultrasonography for pregnant Korean women: a multicenter study and literature review
Article information
Abstract
Objective
To evaluate the clinical significance of soft markers for aneuploidy screening in Korean women.
Methods
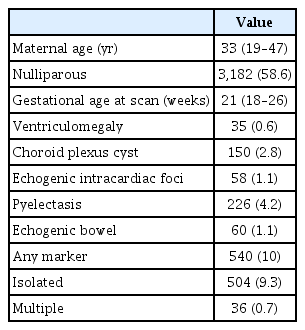
We retrospectively reviewed the medical records of 5,428 singleton pregnant women who underwent sonography during the second trimester at seven institutions in South Korea. We evaluated the prevalence of the following soft markers: intracardiac echogenic focus, choroid plexus cysts, pyelectasis, echogenic bowel, and mild ventriculomegaly. We developed best-fitted regression equations for the fetal femur and humerus length using our data and defined a short femur and humerus as both long bones below the fifth centile. The results of genetic testing and postnatal outcomes were investigated in patients who had been diagnosed with aforementioned soft markers.
Results
The median maternal age of our study population was 33 years, and the median gestational age at the time of ultrasonographic examination was 21 weeks. We detected soft markers in 10.0% (n=540) of fetuses: 9.3% (n=504) were isolated cases and 0.7% (n=36) of cases had two or more markers. We identified only two aneuploides (trisomy 18, 46,XX,t[8;10][q22.1;p13]), of which one was clinically significant. We presented the neonatal outcomes of the fetuses with the respective soft markers. Preterm delivery, low birth weight, and small-for-gestational-age (SGA) were significantly more common in women with a shortened fetal femur (P<0.001, all). However, the presence of a shortened fetal humerus was not associated with those outcomes excluding SGA.
Conclusion
Soft markers in second-trimester ultrasonography have limited use in screening for fetal aneuploidy in Korean women. However, these markers can be used as a screening tool for adverse outcomes other than chromosomal abnormality.
Introduction
Ultrasonographic screening during the second trimester has become a routine practice in prenatal care. Sonographic soft markers were originally identified as being associated with aneuploidy, especially in high-risk pregnancies. Widely used soft markers in mid-trimester ultrasonography include intracardiac echogenic focus (ICEF), echogenic bowel (EB), short femur and humerus, pyelectasis, and choroid plexus cyst (CPC), which are estimated to be observed in between 0.6% and 4.3% of pregnancies [1]. Although these markers were used to recalculate the risk of Down syndrome, there is limited evidence to support the clinical significance of second trimester soft markers in low-risk patients, especially in those who have undergone prior screening with nuchal translucency (NT) or second trimester serum screening [2]. Besides screening for down syndrome, the presence of specific soft markers is known to be associated with non-aneuploidy-related-conditions, such as structural anomalies and pathologic placental conditions [3,4].
In this multicenter study, we analyzed the data of 5,428 pregnant Korean women who had undergone second trimester ultrasounds to determine the clinical significance of soft markers for aneuploidy screening. Additionally, we investigated the pregnancy outcomes of our study participants to evaluate the association between the presence of soft markers and adverse pregnancy outcomes other than chromosomal abnormalities.
Materials and methods
We retrospectively reviewed the medical records of Korean women with singleton pregnancies who underwent sonography for anomaly detection during the second trimester at seven centers (Cheil General Hospital and Women’s Healthcare Center, Samsung Medical Center, Seoul National University Bundang Hospital, Konkuk University Medical Center, Kyung Hee University Hospital at Gangdong, and Dongguk University Ilsan Hospital) between January 2013 and December 2013. We excluded data from pregnant women who had been diagnosed with major fetal anomalies. We collected the fetal biometry data, including femur length (FL), from the seven included centers; however, humerus length (HL) was not measured during routine evaluation at two of these centers.
We evaluated the presence of ICEF, CPCs, EB, pyelectasis, and mild ventriculomegaly (VM) from the results of the second-trimester ultrasonography. ICEF was defined as a focus of echogenicity comparable to bone, in the region of the papillary muscle in either or both ventricles of the fetal heart [5]. CPCs were defined as sonographically discrete, small cysts found in the choroid plexus within the lateral cerebral ventricles [6]. EB was defined as fetal bowel with homogenous areas of echogenicity equal to or greater than those of surrounding bone [7]. Pyelectasis was defined as renal pelvic diameter ≥4 mm, and mild VM was diagnosed when the width of the atrium of at least one of the ventricles in the fetal brain was between 10 and 15 mm.
We investigated the results of genetic testing for aneuploidy and postnatal outcomes in fetuses who had one or more soft markers. Although FL was evaluated at each center in this group, we did not include short FL or HL as a soft marker for aneuploidy screening because of the variation in definitions among centers. Instead, we developed best-fitted regression equations for fetal FL and HL against gestational age based on our data. We defined a short FL (HL) as that below the fifth centile, which was determined based on newly developed charts, and compared the pregnancy outcomes of the fetuses with short FL (HL) to those with normal FL (HL). Pregnancy outcomes included gestational weeks at delivery, birthweight, preterm delivery before 34 and 37 weeks, low birth weight (LBW), and small-for-gestational-age (SGA). The normality of gestational age was assessed using the Shapiro-Wilk test and histogram analysis. To obtain normal ranges for gestational age, a polynomial regression model was used according to the recommended methodology of Royston and Wright [8]. Regression equations and their coefficients were evaluated through a multistep procedure according to the methods recommended by Altman and Chitty [9]. Statistical analyses were performed using R version 3.1.2 (The R Foundation for Statistical Computing, Vienna, Austria).
Results
The general characteristics of the study population and prevalence of soft markers are shown in Table 1. Among them, 93.3% (n=504) were isolated cases and 6.7% (n=36) had two or more markers. Detailed results regarding the respective soft markers are described below.
1. Intracardiac echogenic focus
Among the 58 ICEF cases, eight were positive for other soft markers. They underwent karyotyping, but no chromosomal abnormalities were found. However, none of the patients with ICEF as the only soft marker (n=50) underwent amniocentesis after the second trimester ultrasonography.
2. Choroid plexus cysts
There were 150 cases with CPC, of which 127 (84.7%) were isolated. Most isolated cases (n=120) showed regression of CPC on follow-up ultrasonography during the antenatal period. Twenty-three CPC cases were positive for other soft markers, including one case of trisomy 18 and one with chromosomal translocation 46,XX,t(8;10)(q22.1;p13). Karyotyping was not performed after the second trimester ultrasonography in the isolated CPC cases.
3. Pyelectasis
The overall incidence of fetal pyelectasis was 4.2% (n=226). Among these cases, 66 (29.2%) were bilateral and 205 (90.7%) were identified as the isolated type. In the patients with isolated pyelectasis, amniocentesis was performed after the mid-trimester screening ultrasonography in three pregnant women (over the age of 40 years), and all results were normal. Among 21 pyelectasis cases with one or more other soft markers, amniocentesis was performed in four patients. One fetus who presented with CPC had the karyotype 46,XX,t(8;10)(q22.1;p13). A normal karyotype was confirmed in the other three cases. In the postnatal ultrasonographic examination, 34 neonates (15.0%) had pyelectasis and four (1.8%) were diagnosed with hydronephrosis.
4. Echogenic bowel
Forty-six (76.7%) patients out of 60 patients presented with isolated fetal EB. No karyotyping was performed in the isolated cases after the second trimester ultrasonography in this study. In the 14 EB patients who had more than one soft marker, nine had undergone karyotyping prior to ultrasound. After the second trimester ultrasonography, karyotyping was performed in three cases, and all results were normal. In one case of EB with severe intrauterine growth restriction (IUGR), cordocentesis was performed to detect congenital infection. However, most of the patients with isolated EB did not undergo serologic testing for congenital infection. Intrauterine fetal death (IUFD) was not identified in any of our study participants. However, one male neonate, who had been identified as having a normal karyotype, was delivered at 28 weeks weighing 550 g and died during neonatal intensive care unit admission. Among 54 identifiable cases, nine (16.7%) fetuses were diagnosed with IUGR during pregnancy or identified as SGA neonates after delivery.
5. Mild ventriculomegaly
In our analysis, 35 cases of mild VM were detected, and the ventricle size was between 10 and 12 mm in 32 cases. Most VM cases (88.5%) were unilateral. Initially, 22 VM cases were isolated. Among them, three cases showed additional ultrasonographic findings as follows: 1) one case showed congenital hydrocephalus due to aqueductal stenosis and polymicrogyria, 2) one case showed an intracranial hyperechoic shadow in the lateral side of the frontal horn during antenatal follow-up, and 3) one case showed a small atrial septal defect in the postnatal period. There were no isolated VM cases with congenital infections. Notably, 76.5% of the isolated VM cases showed prenatal regression. No significant difference in the mean ventricular width between regressed and non-regressed cases was found on the second trimester ultrasonographic examinations (10.2±0.3 vs. 10.7±1.0 cm, respectively, P=0.22). Karyotyping was performed in four isolated cases and one non-isolated case. There were no chromosomal abnormalities in the isolated cases, while trisomy 18 was diagnosed in one VM case that was positive for other soft markers. Only one VM patient with more than one soft marker was infected with cytomegalovirus (CMV).
6. Short femur and humerus length
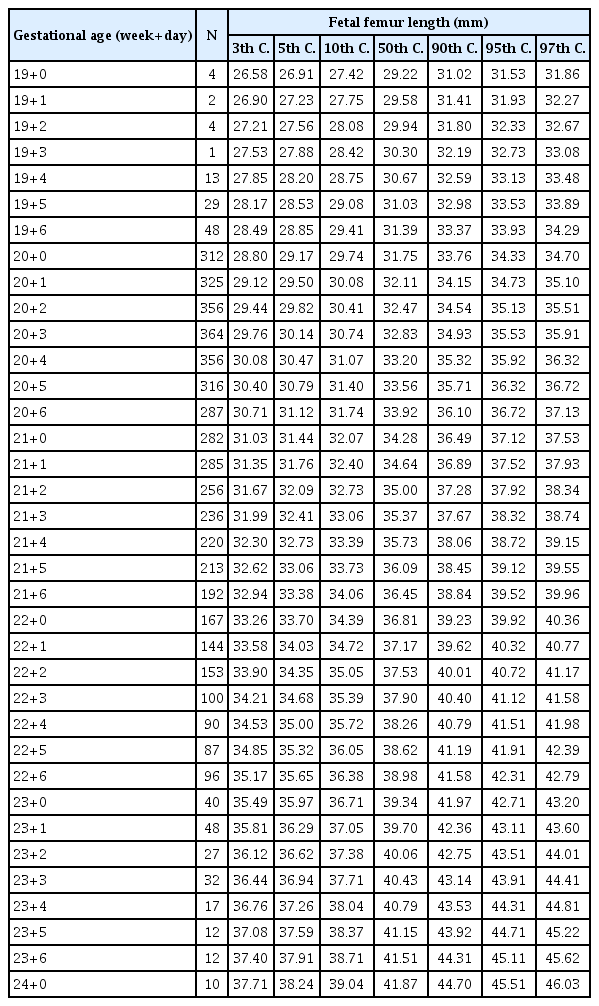
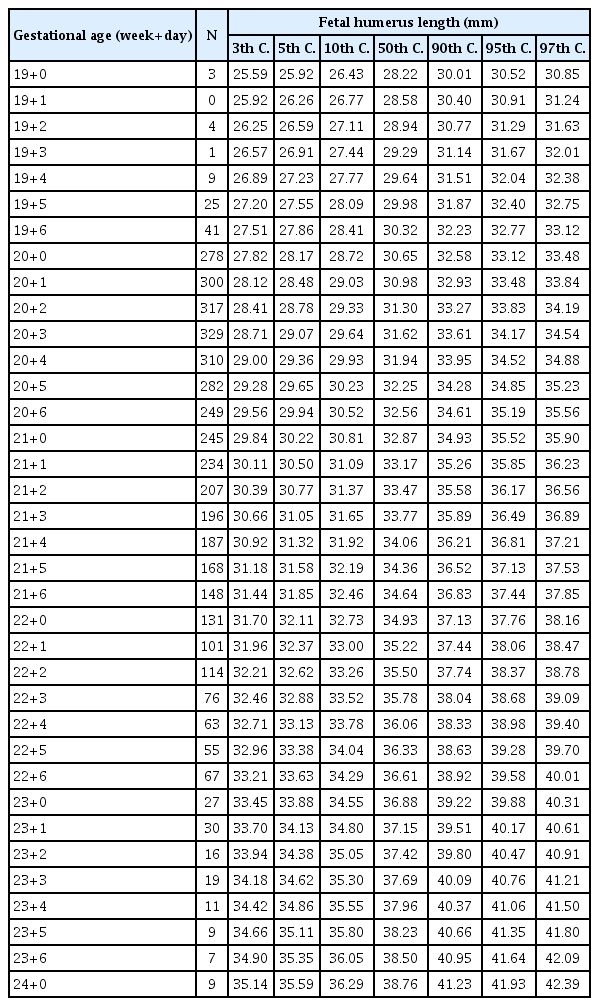
After excluding the data of the patients whose date of pregnancy was uncertain, we constructed new reference charts for fetal FL and HL. The best-fitted regression model that described the relationships between both long bones and gestational age was the cubic model. The corresponding regression equations were as follows:
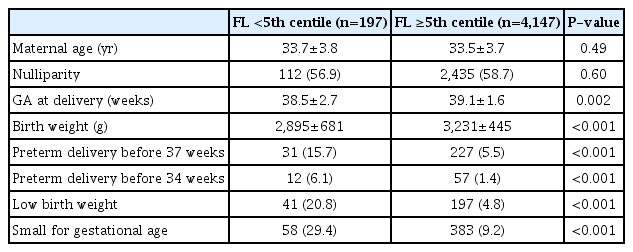
Tables 2, 3 show the newly constructed centile charts with 3rd, 5th, 10th, 50th, 90th, 95th and 97th centiles fitted for FL and HL between 19 and 24 weeks of gestation. When short femur and humerus was defined as the fetus with FL and HL below the fifth centile based on our newly developed charts, no chromosomal abnormality was diagnosed in fetuses with isolated short FL or HL in our study population. Excluding the incomplete data, such as loss to follow up and missing data on key variables, we analyzed 4,344 women’s neonatal outcome. In our analysis, mean gestational age at delivery and mean birth weight were significantly decreased in fetuses with short FL. Furthermore, preterm delivery and LBW, as well as SGA, were significantly more common in those patients (Table 4). Similarly, excluding inadequate data, we analyzed the pregnancy outcomes of 3,423 women who had been evaluated for fetal HL and delivered in our institutions. In this analysis, SGA was significantly more common among fetuses with short HL, but the other outcomes were not different regardless of the presence or absence of short HL (Table 5).
Discussion
We evaluated the prevalence of several second trimester soft markers in pregnant Korean women and determined the clinical significance of such markers through examination of genetic testing and neonatal outcomes.
ICEF is detected in 0.5–20% of genetic sonograms, and it is reportedly more common in Asian than non-Asian individuals [10]. The low prevalence of ICEF in our study population may indicate that ICEF was underreported or not revealed in low-risk patients. It is currently believed that isolated ICEF does not increase the risk of aneuploidy in a population previously evaluated by first-trimester combined screening [11]. Therefore, when isolated ICEF is found in a low-risk patient for whom aneuploidy screening has been performed, no further risk assessment is required. Furthermore, if there is no evidence of altered cardiac function, a detailed echocardiogram is not recommended as long as the second trimester scan is normal [12].
Fetal CPCs are found in 0.18–3.6% of prenatal ultrasonographic examinations. CPCs typically undergo involution and are no longer detectable by the second trimester in serial ultrasound studies [13]. CPC is anechoic and usually simple in appearance, although it can be complex, and it may be unilateral or bilateral. However, the appearance and laterality have no clinical relevance [14]. Most researchers have indicated that isolated CPC is not associated with a higher risk of aneuploidy [15]. In addition, it has been reported that the presence of CPCs does not affect the neurological outcome during childhood [16]. Recent guidelines have suggested that the presence of isolated CPCs does not require ultrasonographic follow up [17].
In a meta-analysis, isolated fetal pyelectasis was found in 1–3% of fetuses during second trimester ultrasonography [18]. In contrast, the prevalence of isolated fetal pyelectasis was 3.8% in our study population. A recent meta-analysis showed that the presence of pyelectasis increases the likelihood of aneuploidy [18]. However, there is a consensus that isolated fetal pyelectasis is not a justification for karyotyping in low-risk patients [3]. Fetal pyelectasis is often associated with congenital hydronephrosis. Thus, when pyelectasis is observed in mid-trimester ultrasonography, follow-up examination is required. In a study of 8,873 pregnant Korean women who underwent routine mid-trimester screening ultrasonography, 249 (2.8%) cases were identified as isolated pyelectasis. Among them, 18.2% were persistent or progressive pyelectasis based on the third trimester ultrasound, and 3.2% were diagnosed with significant neonatal hydronephrosis after delivery [19].
The incidence of EB reported in the literature ranges from 0.2 to 1.8% [20]. In a recent meta-analysis, the risk of chromosomal anomaly was 3.3% in patients with isolated EB [21]. Ekin et al. [22] determined that the risk of chromosomal abnormality was 6.7% in isolated EB cases, but the risk did not significantly increase when other soft markers were present. In contrast, Buiter et al. [20] reported that although the presence of one or two soft markers did not result in chromosomal abnormalities, the presence of three or more soft markers or major anomalies was associated with chromosomal abnormalities in pregnancies complicated by EB.
Congenital infections are associated with EB in 0–10% of cases. In a study by Simon-Bouy et al. [23], 2.8% of fetuses with EB were diagnosed with viral infections: 2.2% with CMV, and 0.6% with parvovirus. Toxoplasmosis, varicellazoster, and herpes simplex infections have been described in the literature, but they are rare. Although fetuses with congenital infections usually present with other abnormal findings on ultrasonography, some cases have no signs other than EB. Therefore, serological tests should be considered to rule out congenital infection even in isolated cases. Previous studies have reported an increased incidence of IUGR and IUFD in fetuses with EB, with incidences of 14.0–23.3% for IUGR and 3.8–8.0% for IUFD. The increased risk is independent of karyotypic abnormalities or congenital infections and persists when EB is an isolated finding [24]. Therefore, serial sonographic follow-up for fetal growth and antenatal surveillance are recommended for patients with fetal EB, even if no other abnormal findings are present.
The prevalence of mild VM is estimated to be approximately 0.7% [25]. Studies that evaluated the karyotype are limited for this condition, but the rate of chromosomal abnormality in isolated mild VM has been reported to be 4–5% [26]. The incidence of chromosomal abnormalities has been reported to increase up to 18.5% in non-isolated VM cases [27]. In Korea, although the rate of karyotype analysis is also very low, the incidence of chromosomal abnormalities in cases of isolated VM has been reported to be less than 2% [28]. In a meta-analysis, among patients with a normal karyotype, associated abnormalities were observed in 33.5%. However, the rate of associated abnormalities that are not detected at the time of first examination (false-negative rate) has been reported to be 12.8% [26]. Therefore, the possibility of postnatal detection of abnormalities in isolated mild VM cases should be mentioned during prenatal counseling. The incidence of CMV as a cause of mild VM varies from 0% to 5%; however, cerebral VM is one of the more common prenatal ultrasonographic abnormalities in fetuses with proven intrauterine transmission of CMV [29]. Despite a weak association between mild VM and congenital infection, maternal blood tests for CMV and toxoplasmosis should be considered during the assessment of VM, because of the potential for treatment, safety, and relatively low cost of the screening tests [30].
A recent study suggested that prenatal counseling for isolated, non-progressive, very mild VM (10–12 mm) should focus on reassurance, as very mild VM is not associated with severe neurodevelopmental delay [31]. However, parents should be informed of developmental milestones that should be observed to detect mild neurodevelopmental delay, which can be associated with mild VM.
We presented reference charts of fetal FL and HL based on the data from our study population. To the best of our knowledge, two high-quality formulas for fetal biometry have been reported for the Korean population [32,33]. Jung et al. [32] collected data from 10,455 Korean women over a five-year period and provided reference charts and equations for fetal biometry without HL. In their study, FL was found to be smaller in Korean fetuses than in Caucasian fetuses. In contrast, a more recent study identified that FL in Korean fetuses was similar to that in Caucasian fetuses, and other long bones maintained a size gap of less than one standard deviation throughout gestation [33]. However, the fetal FLs in our study were close to those presented in the study of Jung et al. [32]. In the future, well-organized research is needed to construct reference charts that can accurately represent the condition of Korean fetuses.
The definition of a short FL varies. A short femur was defined when the femur length measurement compared to the expected femur length measurement for gestational age was ≤0.91 [34]. In contrast, in a national study of 147,776 fetuses in Denmark, 16.8% of the fetuses with Down syndrome had a short FL below the fifth percentile [35]. Cho et al. [36] concluded that short FL is a poor marker of Down syndrome in the second trimester in Korean population. A short humerus was defined by a measured to expected HL ratio ≤0.89 [34]. Gray et al. [37] concluded that an HL below the fifth percentile is the most efficient parameter for the detection of down syndrome. However, a recent meta-analysis showed that an isolated short humerus or femur does not increase the risk of aneuploidy.
When marked shortening of long bones is identified in second trimester ultrasonography, severe skeletal dysplasia should be suspected. Besides, associations have been observed between the presence of a short femur in midtrimester scans and the subsequent development of preterm birth, preeclampsia or SGA [38]. Even though we could not collect the pregnancy outcomes of all neonates in this study because of the retrospective study design, the proportion of preterm delivery, LBW, and SGA were significantly higher in fetuses with short FL. Therefore, when a short femur is suspected at the time of the second trimester screening, follow-up sonography for fetal growth and heightened awareness of preterm birth or preeclampsia are recommended. de Carvalho et al. [39] demonstrated that fetuses with short HL, as well as FL, measured at mid-trimester ultrasonography were significantly associated with fetal growth restriction. However, contrary to short FL, there are few studies regarding the association between short HL and adverse pregnancy outcomes, such as preterm delivery or preeclampsia. In our analysis, SGA was significantly more common in fetuses with short HL, but preterm delivery and LBW were not. Our results imply that the mechanism of short FL and HL can be different, however, further research is needed to confirm our findings.
It has been argued that the presence of soft markers has no additional value in improving the detection of down syndrome in patients deemed to be at low risk at the first-trimester screening. The Korean government provides aneuploidy screening tests at public health centers and supports a portion of expenses that hospitals charge for prenatal care. Therefore, most pregnant Korean women receive aneuploidy screening tests, such as measurements of NT or second-trimester serum screening. Moreover, second-trimester ultrasonography for anomaly scan is usually performed after 18 weeks of gestation in Korea. Accordingly, most pregnant women are aware of their aneuploidy-screening test results before the second-trimester ultrasonography. In this situation, the clinical significance of second-trimester soft markers detected via ultrasonography may be different than those reported previously.
Few studies have investigated the performance of soft markers in a previously screened population. In a study by Kaijomaa et al. [40], only two fetuses had significant aneuploidy among 228 pregnancies that were found to be normal at the first-trimester screening and presented two or more soft markers at the mid-trimester ultrasonographic examination. In our analysis, most fetuses with one or more soft markers presented with a normal karyotype or had no significant findings after delivery. Accordingly, obstetricians should take our results into account when recommending invasive procedures. We did not evaluate the data of the non-invasive prenatal test (NIPT) for aneuploidy, because it had not been established in Korea during our study period. However, the NIPT is a feasible option for women who present with one or more fetal soft markers.
This study has some limitations. First, this study was conducted using a retrospective design. Therefore, it is possible that the incidence of some soft markers may have been underestimated. Second, there is a possibility that we missed some diagnosis of chromosomal abnormalities because not all deliveries were performed in our centers, and not all diagnoses were confirmed by chromosome analysis. However, this study was performed at a tertiary hospital, which enabled us to obtain the pregnancy outcomes from the majority of patients without loss of follow up, especially for those who were at higher risk for aneuploidy. Third, we did not evaluate some well-known markers, such as nuchal fold thickness, because we focused on the soft markers which are known to be associated with adverse pregnancy outcomes other than chromosomal abnormality.
In summary, our study found that the associations between aneuploidy and soft markers detected in the second trimester were less significant than what had been previously reported. However, detailed counseling for each soft marker is still required, especially if the pregnant woman has never undergone aneuploidy screening, or in cases when multiple soft markers are identified. In addition, detection of specific soft markers requires follow up, because some soft markers have potential non-aneuploidy-related associations with poorer pregnancy outcomes. We hope that this report could provide useful information to aid clinicians in the management of soft markers detected in the second trimester.
Acknowledgements
We thank the medical staff who are involved in this research for their assistance.
Notes
Hyun Sun Ko and Han Sung Hwang have been an Editorial Board of Obstetrics & Gynecology Science; however, they are not involved in the peer reviewer selection, evaluation, or decision process of this article. Otherwise, no other potential conflicts of interest relevant to this article were reported.
Conflict of interest
No potential conflict of interest relevant to this article was reported.
Ethical approval
This study does not require approval of the Institutional Review Board because no patient data is contained in this article. The study was performed in accordance with the principles of the Declaration of Helsinki.
Patient consent
Written informed consent and the use of images from patients are not required for the publication.
Funding information
This study was supported by the Ultrasound Research Program, funded by the Korean Society of Ultrasound in Obstetrics and Gynecology, Republic of Korea (201401).


