Influence of internet, mobile phone use, and sociodemographic factors on women’s knowledge and attitude towards contraception in Indonesia
Article information
Abstract
Objective
Rapid population growth has been a problem in Indonesia for several decades. One of the reasons for this phenomenon is limited knowledge of reproductive health and proper contraception methods. The use of mobile phones and the internet has made it easier to access health information. This study aimed to determine the influence of the internet, mobile phone use, and sociodemographic factors on Indonesian women’s knowledge of and attitudes toward contraception.
Methods
The present study used secondary data from the 2017 Indonesian Health and Demographics Survey. Altogether, 49,627 women participated in this study. Descriptive statistics were performed, and bivariate analysis using the chi-squared test was performed to measure the association between variables.
Results
Knowledge about the ovulation cycle and contraception was positively associated with mobile phone ownership, frequent internet use, higher wealth index, reading printed media, listening to the radio, watching the television, higher educational level, and older age. The use and intention of contraception were positively associated with lower wealth index, watching television at least once a week, primary-secondary educational level, rural residence, and older age. Thus, acquisition of knowledge does not necessarily translate into implementation of contraceptive methods, since there might be certain digital and social barriers.
Conclusion
Access to the internet and mobile phones as well as certain sociodemographic factors have contributed to an increase in women’s knowledge about contraception, but not necessarily in their knowledge regarding the use of contraception.
Introduction
Indonesia has one of the highest fertility rates in the world, which was estimated to have reached approximately 2.5 births per woman in 2014. Sustained high fertility rates might result in excessive population growth in the coming years, which could be detrimental to the country’s economy, environment, and natural resources. Various methods to suppress the rate of population growth have been planned and applied in Indonesia since the late 1960s. Education about contraception is one of such methods [1].
Contraception is a core principle in the concept of family planning. It helps women time their pregnancies so that they are not too close together. The use of contraceptives offers many benefits including reduced maternal mortality risk, prevention of unwanted pregnancies, decreased perinatal death, and healthier babies [2,3]. However, since there is a lot of misinformation regarding contraception in Indonesia, education about contraceptives should be provided to sexually active individuals by trained health workers [4,5].
Possessing adequate knowledge about the ovulation cycle and the advantages and disadvantages of various contraceptive agents may help individuals choose the best contraceptive agent for their respective needs [6,7]. In this era of globalization, increased access to the internet and ownership of mobile phones may contribute to women’s knowledge about the choice of contraceptive agents [8,9]. The internet plays a central role in providing an important source of information about contraception and reproductive health for women, congruent with the high level of information available on it in recent years [10]. Women’s wealth status is another factor that affects the use of contraceptive agents. A 2019 study in Indonesia found that the use of contraception was higher among working women and women with a higher socioeconomic status [11]. The present study aimed to assess the extent to which the internet, mobile phone use, and sociodemographic factors influence Indonesian women’s knowledge of and attitudes toward contraception.
Materials and methods
The present study used secondary data obtained from the 2017 Indonesian Health and Demographics Survey. This survey considered the relative standard error for counting the total number of respondents. Subsequently, it was corrected by compromise allocation, including 1,970 blocks in cities. Altogether, 49,627 married women aged 15–49 years provided informed consent to participate in the study. Informed consent was obtained from the parents or spouses of participants under 17 years of age. Data on each participant’s knowledge about contraception, ovulation cycle, and the use and intention of any contraception method was acquired. According to the definition in the 2017 Indonesian Health and Demographics Survey, these three dependent variables were categorized into two outcomes: 1) do not know/do not use and 2) know/use. The means of internet access were investigated, which included ownership of mobile devices that can access the internet and the frequency of internet use during the last month. Respondents’ socioeconomic data were obtained through the wealth index, frequency of reading newspapers or magazines (printed media), frequency of listening to the radio per week, frequency of watching the television per week, highest educational level, location of residence, and age. The data were analyzed using the SPSS software (IBM Corp, Armonk, NY, USA). Descriptive statistics were used to summarize the data regarding the respondents’ ownership of mobile phones, access to the internet, and sociodemographic characteristics. Bivariate analysis using the chi-squared test was performed on the pooled data, and the associations between the variables were presented in terms of odds ratios (ORs) and P-values. All study methods were performed in accordance with the relevant guidelines and regulations, and all experimental protocols were approved by the ethical committee of the Faculty of Medicine Universitas Indonesia, Jakarta.
Results
Altogether, 49,627 respondents consented to participate in this study. The distribution of the respondents’ mobile phone ownership, access to the internet, and sociodemographic variables is presented in Table 1.
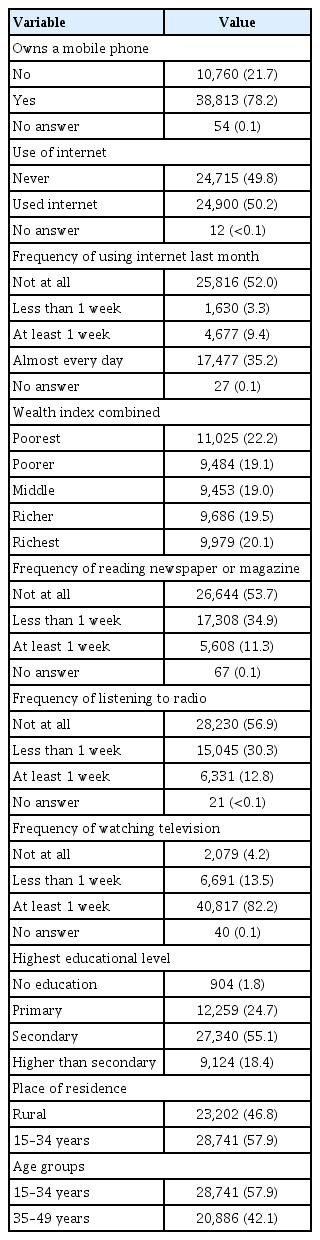
Distribution of respondents according to mobile phone ownership, access to the internet, and sociodemographic variables
Mobile phone ownership was positively associated with knowledge about the ovulation cycle (OR, 1.90; P<0.001; 95% confidence interval [CI], 1.82–2.00) and contraception (OR, 3.53; P<0.001; 95% CI, 3.08–4.04), but negatively associated with the use and intention of contraception (OR, 0.66; P<0.001; 95% CI, 0.63–0.69). An identical trend was observed for the use of the internet. The odds of possessing knowledge about the ovulation cycle (OR, 1.50; P<0.001; 95% CI, 1.44–1.56) and contraception (OR, 1.97; P<0.001; 95% CI, 1.71–2.27) were higher among those who used the internet, while internet use showed a negative correlation with the use of contraception (OR, 0.37; P<0.001; 95% CI, 0.36–0.39). In terms of frequency of internet usage, all levels of internet consumption showed a lower OR for contraceptive use than did no use of the internet. More frequent internet usage was positively associated with knowledge about contraception. However, the correlation was significant only when the internet was used less than 1 week (OR, 1.70; P=0.014; 95% CI, 1.1–2.6) or when it was used almost every day (OR, 2.26; P<0.001; 95% CI, 1.9–2.67). Using the internet at least 1 week (OR, 1.13; P=0.001; 95% CI, 1.05–1.21) or almost every day (OR, 1.73; P<0.001; 95% CI, 1.65–1.81) also showed a significant positive association with knowledge about the ovulation cycle.
A surprising pattern was observed regarding wealth status wherein the use of contraceptives was positively correlated with lower economic status (OR, 1.14; P<0.001; 95% CI, 1.08–1.2), but negatively correlated with the highest economic status (OR, 0.92; P=0.005; 95% CI, 0.88–0.98). Nevertheless, a significant positive correlation was observed between increasing wealth index and knowledge about the ovulation cycle and contraception.
Reading printed media, listening to the radio, and watching the television showed a significant positive correlation with knowledge about the ovulation cycle and contraception regardless of the frequency per week. Reading printed media and listening to the radio showed a significant negative correlation with the use of contraceptives, while watching the television at least 1 week showed a significant positive correlation with the use of contraceptives (OR, 1.38; P<0.001; 95% CI, 1.26–1.51).
Women’s education at all levels showed a significant positive association with knowledge about contraception and the ovulation cycle. A positive association was also observed with the use of contraceptives, but only up to secondary level of education (OR, 1.60; 95% CI, 1.39–1.85 for primary education; OR, 2.79; 95% CI, 2.41–3.23 for secondary education; P<0.001). Educational background higher than the secondary level showed no significant correlation with the use and intention of contraception (OR, 1.00; P=0.981; 95% CI, 0.86–1.16). A negative association was observed between rural residence and knowledge about contraception (OR, 0.47; P<0.001; 95% CI, 0.4–0.54) and the ovulation cycle (OR, 0.63; P<0.001; 95% CI, 0.60–0.66). Surprisingly, rural residence was positively associated with the use of contraceptives (OR, 1.22; P<0.001; 95% CI, 1.18–1.27). Older age (35–49 years) showed a significant positive association with knowledge about contraception and the ovulation cycle as well as with the use of contraceptives (Table 2).
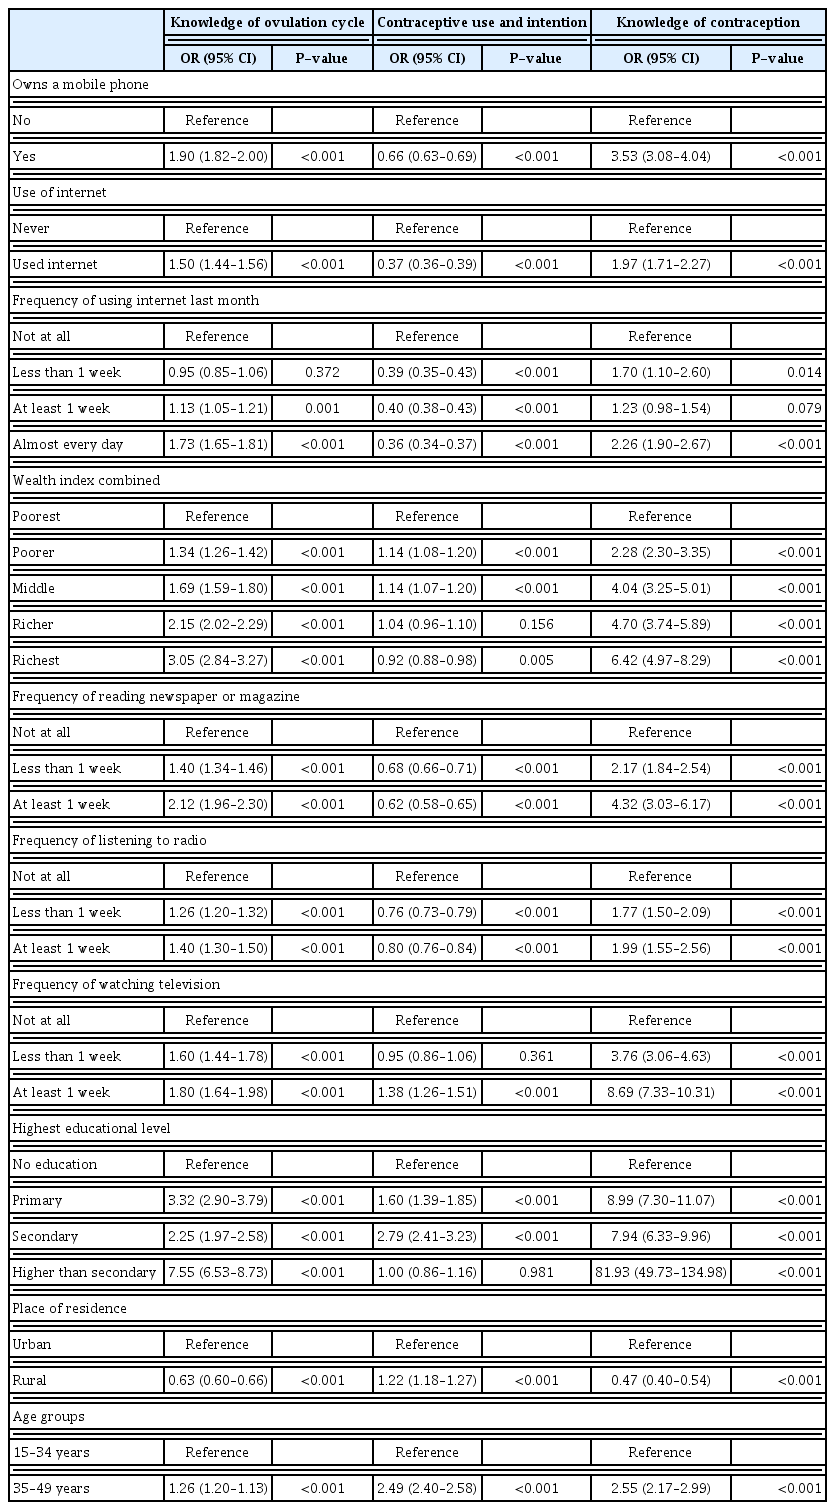
Correlation of different variables with knowledge of the ovulation cycle, contraceptive use and intention, and knowledge of contraception
Discussion
Over the past few years, internet use has contributed to knowledge regarding health. Internet engagement was positively related to knowledge level and education in adults aged 40–70 years, and the association was particularly stronger for health information than for other types of information [12]. In the era of globalization, growing technological development ultimately results in wider internet accessibility, which is closely associated with increased health information and knowledge. Mobile phones are one of the most commonly used tools for accessing the internet. According to a recent survey, the number of smartphone users in Indonesia reached approximately 199.2 million in 2021, making it the fourth largest smartphone market worldwide [13]. Mobile phones allow individuals to discover information regarding reproductive health including insights into less popular contraceptive methods [14]. The growing availability of low-cost mobile phones with internet access ensures equal access to health information for individuals having lower socioeconomic status and those living in rural areas, although stable internet connection in secluded regions of Indonesia remains a problem. The findings of this study support the notion that individuals having access to mobile phones and the internet are more likely to have adequate knowledge about reproductive health and contraception.
Interestingly, the use of contraception showed a negative correlation with access to mobile phones and the internet. A potential explanation for this finding is that despite the use of mobile phones, women might be less willing to exchange the information they retrieve from the internet with their physicians, especially the information related to sexual health and implementation of contraception [15]. This may stem from the fear of being judged or a poor patient-doctor relationship. Another reason that may impede the use of contraception is information overload on the internet, which may make patients skeptical about which information to trust or disregard. A website’s credibility affects the patients’ decision to trust and implement the health information found on the internet [16,17]. Healthcare workers must be encouraged to recommend reliable websites for health information, which may help reduce suspicion of false health information and prevent information overload [16]. In addition to information overload, circulating myths related to sexual health constitute another problem that could possibly decrease patients’ trust in online health information [18].
Certain sociodemographic factors have also been linked to knowledge and attitude toward contraception. These include wealth index, educational level, place of residence, and age. Place of residence may indirectly reflect an individual’s socioeconomic status, since poverty was found to be more prevalent in rural areas than in urban areas, affecting the availability of quality information [19]. A previous study in Indonesia observed that women with a higher wealth index were much more likely to use contraception [5]. Similarly, studies performed in Malawi and Ghana reported that a lower wealth index was associated with a lower rate of contraception use [20,21]. In contrast, findings from the present study showed that women with a poorer wealth index were more likely to use contraception. The present study supported previous observations wherein higher use of contraception was encountered among women residing in rural areas [5]. Reasons for these trends may involve certain social and family barriers and should be explored in the future. It is not surprising that older women (35–49 years of age) were more likely to use contraception and to possess greater knowledge about contraception than younger women (15–39 years of age). Older women are more likely to be equipped with greater wealth of information through information media (internet, printed media, radio, and television) or personal experience.
Television appears to be the only medium other than the internet, which showed a consistent positive correlation with both knowledge and use of contraception. This finding is similar to that reported in a previous study. However, the aforementioned study did not assess the correlation between contraception use and other media such as magazines, newspapers, and the radio [5]. Previous research has shown that well-developed, targeted, and localized content helps individuals accept information more readily [22]. Television has the advantage of utilizing attractive visual aids in the form of videos and animations to deliver health information, which can attract the viewers’ interest more easily than magazines, newspapers, or the radio. Nevertheless, a study conducted by Jacobs et al. [23] found that some individuals still prefer seeking information from printed media such as books, brochures, and magazines; while others still use the radio as a source of information [24]. These arguments support the finding of a positive correlation between knowledge about contraception and the use of different types of media as trusted sources of information. However, this acquisition of knowledge does not necessarily mean increased implementation of the information obtained, as observed in the present study. Further research is needed to determine the factors impeding the implementation of the knowledge obtained from printed media and the radio.
Access to mobile phones and the internet may help increase women’s knowledge about contraception and reproductive health, but it does not necessarily empower them to implement contraception. Information overload, existing myths related to contraception, and reluctance to consult healthcare professionals for information regarding sexual health may hinder women from using contraception despite possessing the necessary knowledge for decision-making. Television appears to be the most effective medium for educating and persuading women to use contraception when watched at least once a week. Educational programs regarding contraception should focus on utilizing various information media to deliver attractive, targeted content to increase not only the knowledge about contraception but also its usage. Future research should be conducted to investigate potential social and family barriers that may hinder the use of contraception, in the context of certain sociodemographic factors such as wealth index, place of residence, level of education, and age.
Acknowledgment
The authors would like to thank the National Population and Family Planning Board for supporting this study.
Notes
Conflict of interest
The authors declare that they have no competing interests.
Ethical approval
This study protocol was approved by Ethics Committee of Faculty of Medicine Universitas Indonesia/dr. Cipto Mangunkusumo Hospital, with the ethical clearance reference number KET-581/UN2.F1/ETIK/PPM.00.02/2022.
Patient consent
All subjects have given informed consent for the research purpose.
Funding information
None.