Clinical outcome after high dose rate intracavitary brachytherapy with traditional point ‘A’ dose prescription in locally advanced carcinoma of uterine cervix: dosimetric analysis from the perspective of computed tomography imaging-based 3-dimensional treatment planning
Article information

Abstract
Objective
To analyze tumour response and toxicity with respect to cumulative radiotherapy dose to target and organs at risk (OARs) with computed tomography (CT)-based image guided adaptive brachytherapy planning for locally advanced carcinoma cervix.
Methods
Patients were treated with two-dimensional concurrent chemoradiotherapy to whole pelvis followed by intracavitary brachytherapy (ICBT) with dose prescription to point ‘A’. CT image-based delineation of high-risk clinical target volume (HR-CTV), urinary bladder, rectum and sigmoid colon was done with generation of dose-volume histogram (DVH) data and optimization of doses to target and OARs. Follow up assessments were done for response of disease and toxicity with generation of data for statistical analysis.
Results
One hundred thirty-six patients were enrolled in the study. Delineated volume of HR-CTV ranged from 20.9 to 37.1 mL, with median value of 30.2 mL. The equivalent dose in 2 Gy per fraction (EQD2) for point ‘A’ ranged from 71.31 to 79.75 Gy with median value of 75.1 Gy and EQD2 HR-CTV D90 ranged from 71.9 to 89.7 Gy with median value of 85.1 Gy. 69.2% of patients showed complete response and after median follow-up of 25 months, 50 patients remained disease free, of whom, 74.0% had received ≥85 Gy to HR-CTV D90 versus 26.0% receiving <85 Gy to HR-CTV D90.
Conclusions
Amidst the unavailability of magnetic resonance imaging facilities in low middle income countries, incorporation of CT-image based treatment planning into routine practice for ICBT provides the scope to delineate volumes of target and OARs and to generate DVH data, which can prove to be a better surrogate for disease response and toxicity.
Introduction
Cervical cancer is the fourth most frequently diagnosed cancer and the fourth leading cause of cancer-related deaths in women, with an estimated 604,000 new cases and 342,000 deaths worldwide in 2020. In India, cervix uteri cancer is the third most common cancer, with an incidence rate of 18.3% (123,907 cases) and the second leading cause of death with a mortality rate of 9.1% [1].
Concurrent chemoradiotherapy (CTRT) followed by intracavitary brachytherapy (ICBT) is the standard of care for the definitive treatment of locally advanced uterine cervical carcinoma. Among several systems designed to guide applicator insertion, the Manchester system developed in the 1930s was the most popular. It used point ‘A’ for dose prescription, based on two-dimensional (2D) X-ray imaging, which cannot visualize the cervical tumor.
In the 1980s, advancements in radiotherapy techniques made it possible to plan treatment based on three-dimensional (3D) images, such as computed tomography (CT) and magnetic resonance imaging (MRI). The International Commission in Radiation Units and Measurements (ICRU) report 38, issued in 1985, recommended using a target volume rather than point ‘A’ for reporting radiation dose [2].
Clinical dose prescription has been transitioning away from the 2D to 3D/volumetric approach, based on the dose-volume histogram (DVH), where dosimetric coverage of the clinical target volume (CTV) and organs at risk (OARs) are evaluated [3]. The Groupe Européen de Curiethérapie-European Society for Radiotherapy & Oncology (GEC-ESTRO) guidelines [4,5] and report 89 of the ICRU [6] aided the implementation of image-guided treatment planning in brachytherapy, which was supported by the American Brachytherapy Society (ABS) guidelines [7,8]. These guidelines are based on MRI, recommending high-risk CVT (HR-CTV) D90 for dose reporting in cervical tumors and D2cc for the bladder and rectum.
However, to date, for ICBT, in most institutions worldwide, especially in low-middle-income countries, ‘point A’ dose prescription remains widely practiced, primarily due to the inadequate availability of MRI and MR-compatible applicators. For the same reason, despite the gross differences in treatment planning between MRI- and CT-based imaging regarding the accuracy of delineation of HR-CTV and OARs [9,10], in most institutions practicing 3D/volumetric treatment planning, CT imaging is used for target volume delineation and subsequent dose prescription.
Both ABS and GEC-ESTRO recommend recording conventional ‘point A’ doses during 3D-image-based treatment planning, at least during the ongoing transition period [11,12].
With this background, this study aims to evaluate, in patients with locally advanced cervical carcinoma treated with CTRT followed by high dose rate (HDR) ICBT, the dosimetric parameters of conventional ‘point A’-based dose prescription from the viewpoint of CT-image guided treatment planning and to corroborate the findings with respect to the clinical outcome of the patients after treatment.
The objective of this study was to analyze tumor response at 3 months post-treatment, disease-free survival (DFS), overall survival (OS), and significant bowel and bladder toxicity from the perspective of the cumulative dose received by the target volume from CT-based image-guided adaptive brachytherapy (IGABT) planning.
Materials and methods
This single-institutional hospital-based prospective study was conducted in the Radiation Oncology Department of a government medical college in eastern India between January 2020 and June 2022. A convenience sampling method was used to enroll the participants. Women with biopsy-proven squamous cell carcinoma of the uterine cervix belonging to the 2018 International Federation of Gynecology and Obstetrics (FIGO) stages IIB-IIIB, aged 18–70 years and with an Eastern Cooperative Oncology Group (ECOG) performance score between 0 and 2 were included in this study. Patients who underwent hysterectomy, received neoadjuvant chemotherapy, or had a history of pelvic radiotherapy were excluded. Pregnant and lactating women were excluded from this study. Patients incapable of following medical advice due to major psychiatric illnesses or any physical deformity rendering them unsuitable for positioning and immobilization for external beam radiotherapy (EBRT) or ICBT were also excluded from the study. Patients unable to complete the scheduled course of treatment and those who refused to provide informed consent were also excluded.
1. Study technique
Patients were treated with 2D radiotherapy to the whole pelvis at a dose of 50 Gy in 25 fractions over 5 weeks with a Theratron 780 C teletherapy machine (MDS Canada Inc., Kanata, ON, Canada) (using Cobalt 60 as the source) with a dose prescribed to the mid-plane at the central axis, without any midline shielding, with a bladder protocol of voiding followed by drinking 750 mL water 45 minutes before treatment, along with administration of concurrent chemotherapy (Inj. Cisplatin, 40 mg/m2, once weekly). This was followed by a clinical examination to assess disease response after EBRT. Next, ICBT was done with a dose of 7.0 Gy/fraction prescribed to point 'A', 1 fraction per week in 3 consecutive weeks with HDR 60Co multi-source remote after-loader system (Eckert & Ziegler BEBIG GmbH Inc., Berlin, Germany) using Fletcher Suit delclos intrauterine applicator and ovoids.
For ICBT, applicators were inserted using an empty bladder and rectum under intravenous sedation. Contrast-enhanced CT imaging with a slice thickness of 2.5 mm, starting from the level of the umbilicus up to the mid-thigh, was performed in the same position as that during the actual treatment after each brachytherapy applicator insertion. Planning images obtained in the Digital Imaging and Communications in Medicine format were transferred to the brachytherapy treatment planning software HDRplus 3.0 (Eckert & Ziegler BEBIG GmbH Inc.). Dose prescription was normalized as per tradition to point ‘A’. Delineation of the HR-CTV, urinary bladder, rectum, and sigmoid colon volumes was performed according to the CT-based contouring guidelines by Viswanathan et al. [9] on the CT planning images. DVH data for the target (HR-CTV D90) and OARs (D2cc) were generated and recorded. The equivalent dose in 2 (EQD2) of the cumulative doses received by the HR-CTV D90 and D2cc for OARs were calculated and recorded using an appropriate dose calculation spreadsheet. Doses to the HR-CTV and OARs were optimized in agreement with the GEC-ESTRO guidelines [5]. Changes in delineated volumes in subsequent fractions were considered for adaptive treatment planning.
2. Data collection and interpretation
Follow-up assessments were performed immediately after completion of brachytherapy and then at every 3-month interval to assess the response to treatment according to World Health Organization (WHO) response criteria and treatment toxicity as per NCI CTCAE version 5.0 (Cancer Therapy Evaluation Program, Rockville, MD, USA). Each visit for assessment included a clinical examination, including a detailed general survey, and gynecological assessment, including per-abdominal, per-speculum, per-vaginal, per-rectal, and bi-manual examinations. Cervical cytology, chest radiography, and abdominopelvic CT were performed when clinically indicated.
Three months after treatment, the patients were classified into two groups according to the WHO criteria for response assessment: complete response and residual disease (partial response, stable disease, and progressive disease). Patients in the complete response group were assessed until the end of the follow-up period. In contrast, those in the residual disease group and those who developed recurrence were treated with palliative chemotherapy according to the institutional protocol and followed up. Locoregional recurrence was suspected when patients developed new-onset vaginal bleeding not otherwise explained, abdominal pain, or positive findings on gynecologic examination or CT scan of the pelvis and turned out to be positive for malignancy on cervical biopsy/cytology. The patients’ DFS and OS were assessed.
Toxicities to the urinary bladder and bowel occurring 90 days after the initiation of radiotherapy were considered late and were recorded.
3. Statistical analysis
Data were analyzed using the Statistical Package for Social Sciences version 26.0 (IBM, Chicago, IL, USA). Comparative results were derived using cross tables and chi-square tests. Survival analysis was performed using the Kaplan-Meier method with the log-rank test. Cox regression analysis was used to assess the hazard ratios. P-value was calculated using a significance level of <0.05 for type I error.
Results
This study enrolled 144 patients between January 2020 and December 2020. Of these, three patients did not turn up for treatment, and five did not complete the total course of CTRT and brachytherapy. Ultimately, 136 patients were included in the study. The patients were followed-up until June 2022, with a median follow-up period of 25 months.
1. Baseline patient and tumor characteristics
The patients were aged 32–68 years, with a median age of 51 years. Eighty-seven patients (64.0%) were post-menopausal, and 41.2% had ECOG Performance Status 0. The commonest stage was FIGO IIB (36.76%), followed by IIIB (33.08%) and IIIA (30.14%). Details of the baseline characteristics are presented in Table 1.
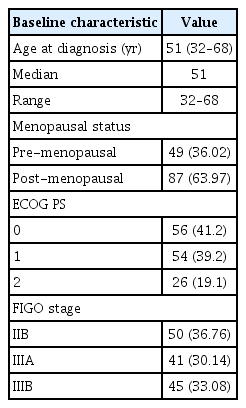
Showing the baseline characteristics of patients and tumor
2. Dosimetric analysis
The delineated volume of HR-CTV ranged from 20.9 to 37.1 mL, with a median of 30.2 mL. Cumulative EQD2 for point ‘A’ ranged from 71.3 to 79.7 Gy with a median of 75.1 Gy. The cumulative EQD2 HR-CTV D90 ranged from 71.92 to 89.66 Gy, with a median of 85.31 Gy. The details of the dosimetry data are presented in Table 2.
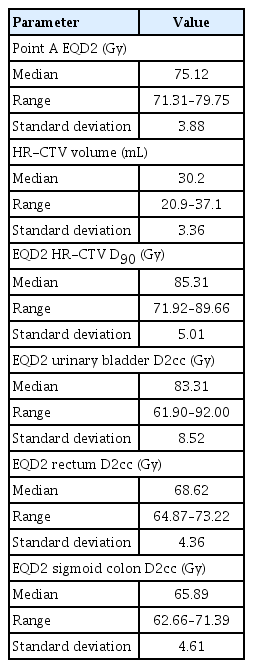
Showing the data from dosimetric analysis
3. Survival data
Cumulative EQD2 after EBRT+ICBT to point ‘A’ ranged from 71.31 to 79.75 Gy with a median of 75.12 Gy. The median cumulative dose (EQD2) after EBRT+ICBT to HR-CTV D90 was found to be 85.3 Gy, with 71 patients (52.2%) having received ≥85 Gy and 65 patients (47.8%) having received <85 Gy.
So, to analyze the response to treatment, the patients were divided into two groups- one having received ≥85 Gy to HR-CTV D90 and another having received <85 Gy to HR-CTV D90 cumulatively after EBRT+ICBT.
1) Response to treatment at 3 months after treatment
Three patients were lost to follow-up. Ninety-two patients (69.2%) showed complete response, out of which 55 (59.8%) had received ≥85 Gy to HR-CTV D90 and 37 (40.2%) had received <85 Gy to HR-CTV D90 (P<0.05). Of those who were disease-free at 3 months of follow-up, as per the contoured volume of HR-CTV, 49 patients (53.3%) had a volume <30 mL, and 43 (46.7%) had a volume ≥30 mL (P>0.05). Stage-wise, complete response was observed in 69.0%, 60.0%, and 59.0% of stages IIB, IIIA, and IIIB, respectively, at 3 months after treatment.
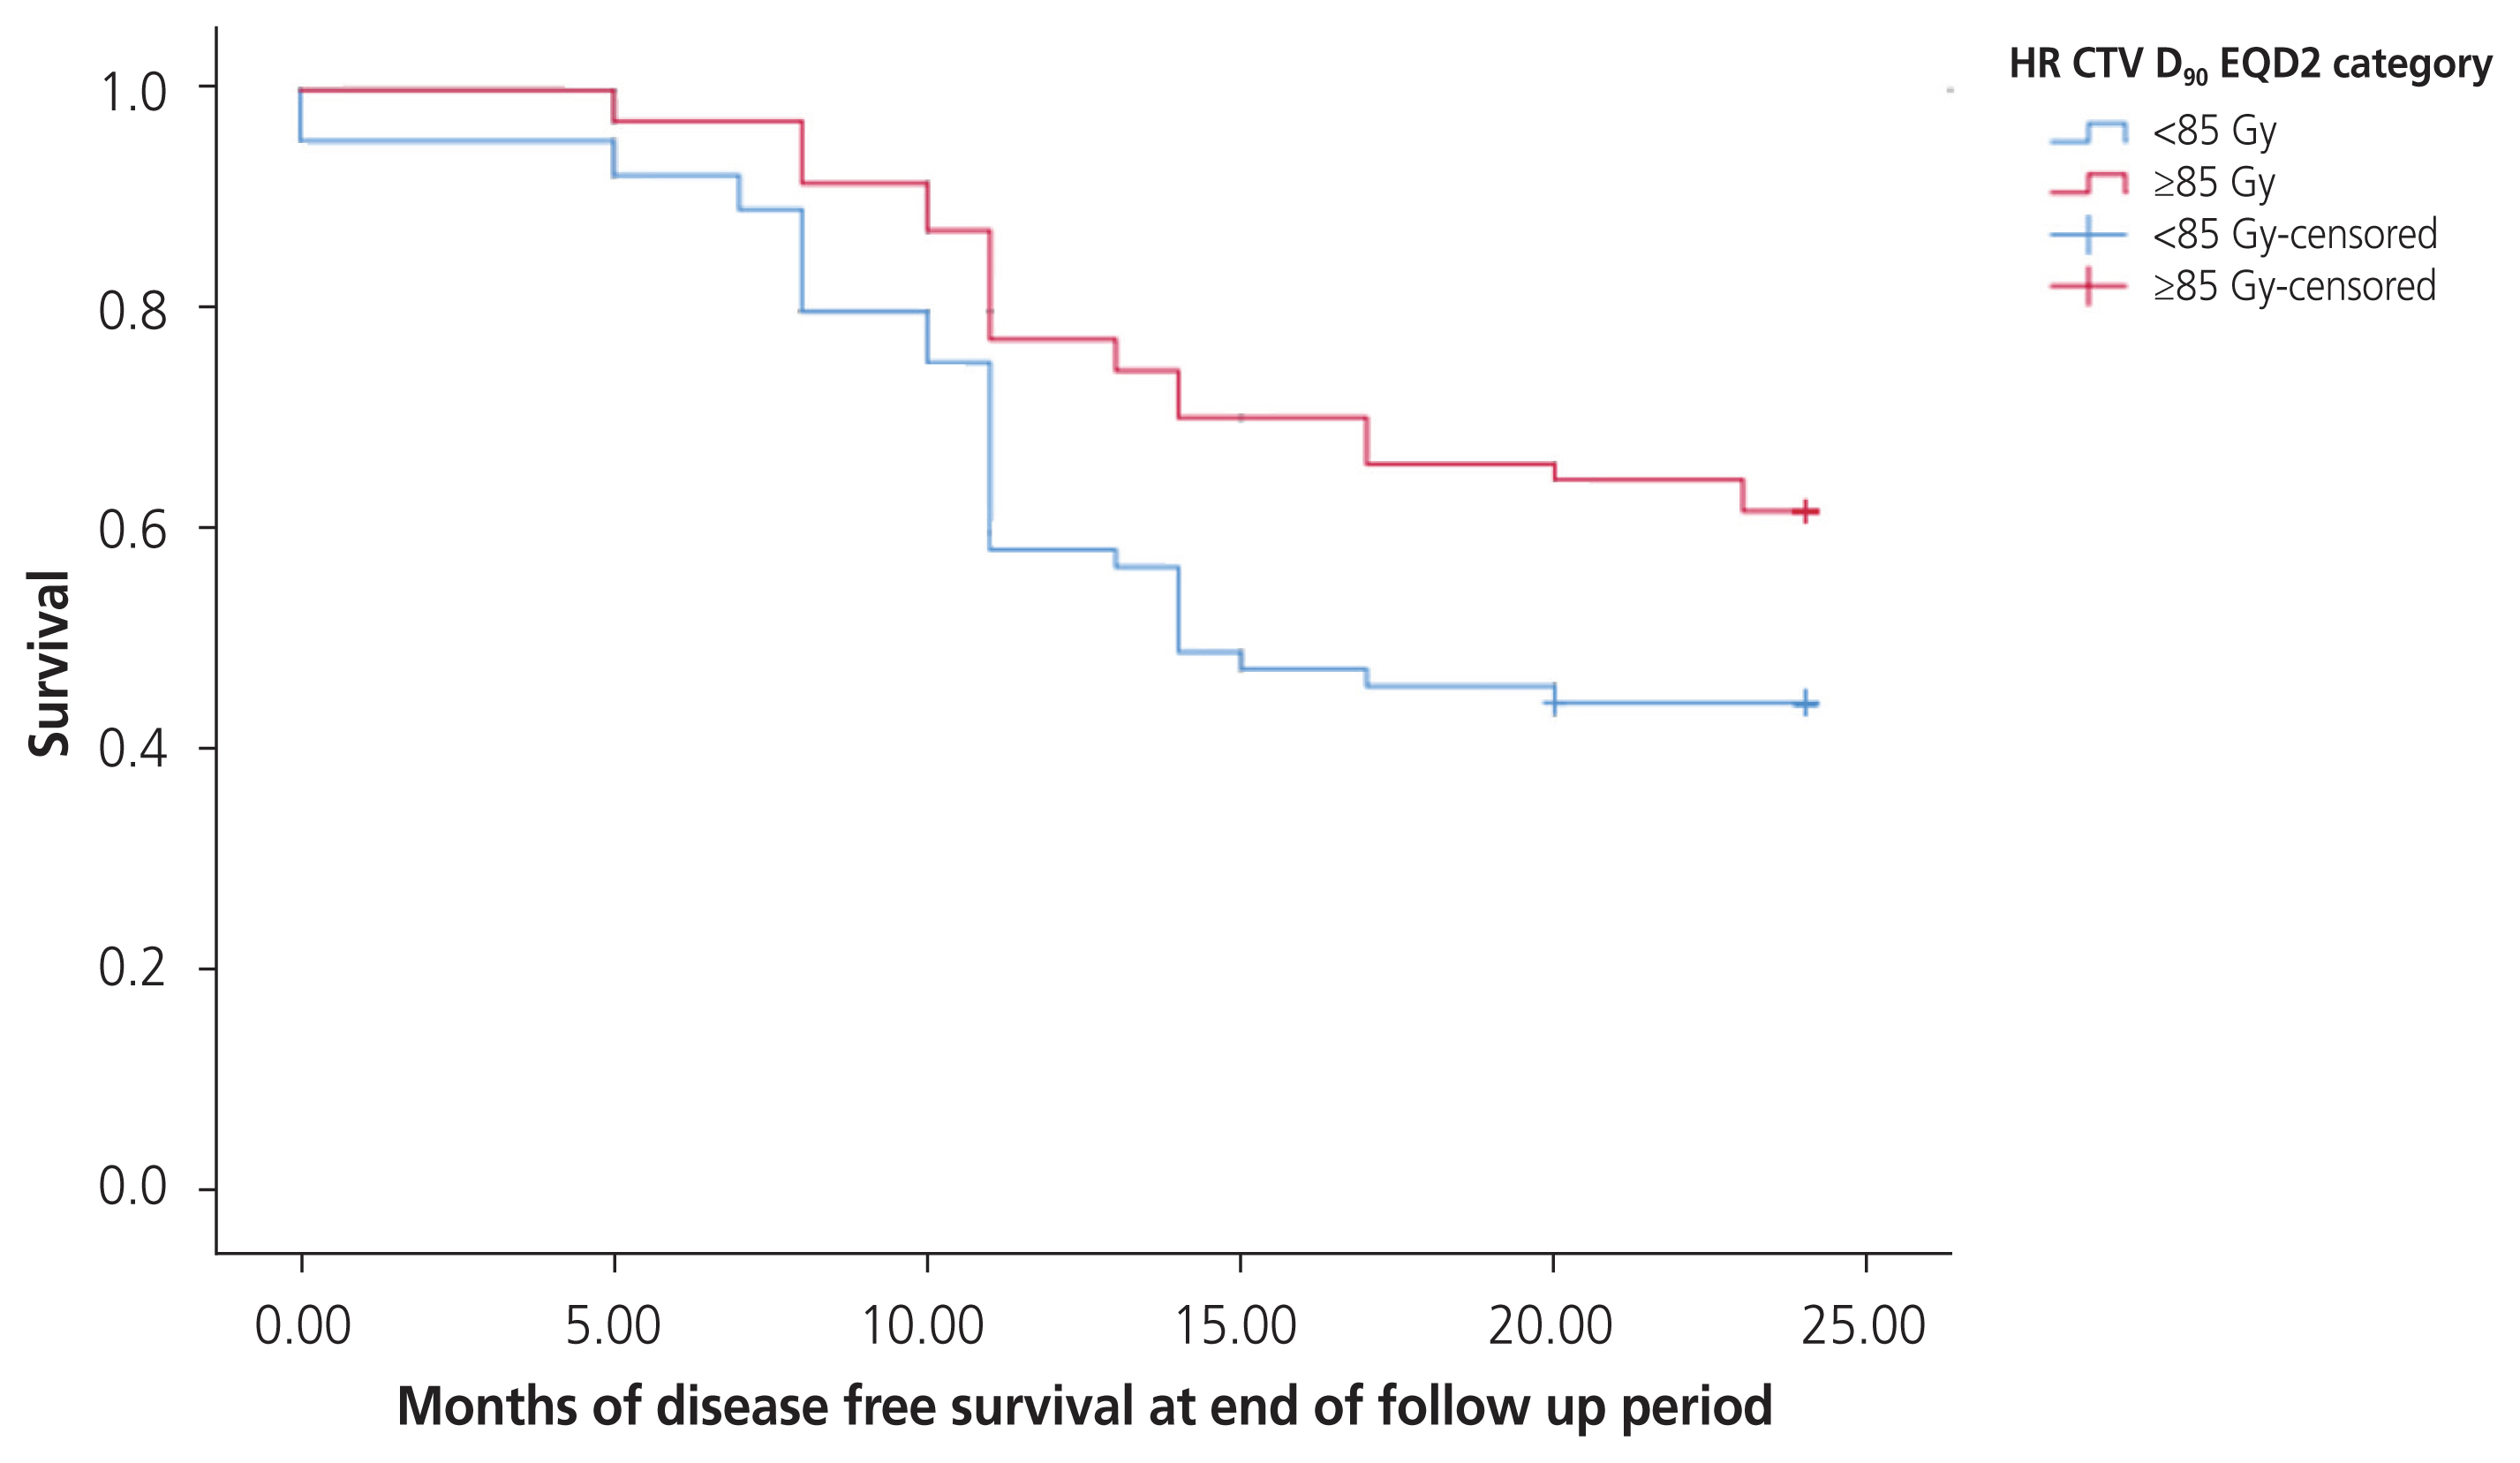
2) Disease free survival
At a median follow-up of 25 months after treatment, 50 patients remained disease free; 74.0% had received ≥85 Gy to HR-CTV D90, and 26.0% received <85 Gy to HR-CTV D90 (P<0.005; HR, 0.45; 95% confidence interval [CI], 0.29–0.69). Of those who were disease-free at the end of the follow-up, as per the contoured volume of HR-CTV, 56.0% had a volume <30 mL, and 44.0% had a volume ≥30 mL (P>0.05). Stage-wise, DFS was observed in 50.0% of stage IIB, 20.0% of stage IIIA, and 28.2% of stage IIIB at the end of follow-up. The pattern of DFS over the follow-up period is depicted in the Kaplan-Meier survival plot in Fig. 1.

Kaplan-Meier survival plot showing disease free survival at end of follow up period in the population with respect to HR-CTV D90 EQD2 category. HR, high-risk; CTV, clinical target volume; EQD2, equivalent dose in 2 Gy per fraction.
3) Overall survival
At a median follow-up of 25 months after treatment, 63 patients had died or were lost to follow-up. Seventy-three patients (69.2%) were alive, of which 44 (60.3%) had received ≥85 Gy to HR-CTV D90 vs. 29 (39.7%) receiving <85 Gy to HR-CTV D90 (P<0.05; HR, 0.58; 95% CI, 0.35–0.95). Of those who were alive at the end of the follow-up, as per the contoured volume of HR-CTV, 37 patients (50.7%) had a volume <30 mL, and 36 (49.3%) had a volume ≥30 mL (P>0.05). Stage-wise, OS was observed in 32 (64.0%) of the 50 patients with stage IIB, 19 (46.34%) of 41 patients with stage IIIA, and 18 (40.0%) of 45 patients with stage IIIB at the end of follow-up. The survival pattern over the follow-up period is depicted in the Kaplan-Meier survival plot in Fig. 2.
Kaplan-Meier survival plot showing overall survival at end of follow up period in the population with respect to HR-CTV D90 EQD2 category. HR, high-risk; CTV, clinical target volume; EQD2, equivalent dose in 2 Gy per fraction.
4. Toxicity data
Acute toxicity of grade 3 comprised of moist desquamation (47.0%), anaemia (29.0%), and leukopenia (22.0%). Late toxicity was observed in the form of urinary incontinence (56.9%), dysuria (46.2%), edema of the lower abdomen and genital region (68.3%), vaginal stenosis (32.4%), and rectal hemorrhage (8.1%). The organ-specific occurrences of toxicity are presented in Table 3.
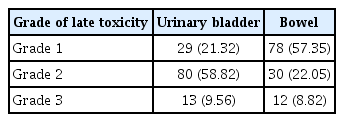
Showing the organ-specific toxicity data
Discussion
Volumetric dose prescription and optimization are more accurate predictors of the disease response to treatment than conventional point ‘A’-based treatment planning. For several reasons, 3D image-based treatment planning should be incorporated into routine practice for HDR-ICBT in managing locally advanced carcinoma of the uterine cervix.
In this study, all the patients were subjected to the same dose of radiation in terms of EBRT (50 Gy/25#/5 weeks; median dose: 48 Gy) and ICBT with point ‘A’ dose prescription (7 Gy/fraction, once weekly for 3 consecutive weeks). CT imaging was chosen as the method for 3D volumetric imaging in ICBT treatment planning.
Kirisits et al. [13] found in their study in 2005 on patients with cervical carcinoma that the total prescribed dose was approximately 85 Gy, mainly achieved with 45 Gy EBRT plus 4×7 Gy MRI-based ICBT (total 84 Gy). The mean dose was 82 Gy at point A (left, right). The average dose to the CTV was 66 Gy for the minimum target dose and 87 Gy for the dose received by at least 90.0% of the volume. The mean D2cc in the bladder was 83 Gy. The average dose to the rectum was 64 Gy for D2cc [13]. Kim et al. [14] found that image-based 3D brachytherapy provided adequate dose coverage to the HR-CTV, with an acceptable dose to the OARs in most patients. The dose to point 'A' was significantly lower than D90 for HR-CTV calculated using an image-based technique [14]. This study shows that the delineated volume of HR-CTV ranged from 20.9 to 37.1 mL, with a median of 30.2 mL. Cumulative EQD2 after EBRT+ICBT to point ‘A’ ranged from 71.31 to 79.75 Gy with a median of 75.12 Gy. The cumulative EQD2 values after EBRT+ICBT to the HR-CTV D90 ranged from 71.92 to 89.66 Gy with a median of 85.31 Gy. The median D2cc values in the bladder, rectum, and sigmoid colon were 83.1 Gy, 68.62 Gy, and 65.89 Gy, respectively. Despite the patients being subjected to the identical dose prescription schedule normalized at point ‘A’, we have seen that the cumulative dose received by the target volume was not the same across the patients, as it should have been by theory. The same was true for the doses administered to the OARs.
Shi et al. [15] found in their study that commonest grade 3+ toxicities after concurrent chemoradiation in 121 patients of carcinoma cervix stages I-III were low absolute lymphocyte count (n=115, 95.0%), low white blood cell count (n=21, 17.0%), and anemia (n=11, 9.0%). In our study, acute toxicity of grade 3 comprised of moist desquamation (47.0%), anaemia (29.0%), and leukopenia (22.0%). In 2007, Pötter et al. [16] reported a mean D90 of 86 Gy. Complete remission at 3 months was achieved in 95.0% of patients. OS was 58.0% at 3 years. Actuarial late morbidity rates (LENT SOMA, grades 3 and 4) at 3 years were gastrointestinal 4.0%, urinary 4.0%, and vaginal 5.0% (stage IIA/IIIA) [16]. In another study by Pötter et al. [17] in patients with cervical cancer treated with IGABT combined with 3D conformal EBRT±chemotherapy in 2011, the total prescribed mean dose was 93±13 Gy, and D2cc was 86±17 Gy for the bladder, 65±9 Gy for the rectum, and 64±9 Gy for the sigmoid colon. Complete remission was achieved in 97.0% of patients. Overall local control at 3 years was 95.0% [17]. Compared to the study by Pötter et al. [17], in this study, 3 months post-treatment, 92 patients (69.17%) showed complete remission, of which 55 (59.78%) had received ≥85 Gy to HR-CTV D90, and 37 (40.21%) had received <85 Gy to HR-CTV D90 (P=0.016). At the end of the follow-up period, 50 patients, 37 (74.0%) had received ≥85 Gy to HR-CTV D90 vs. 13 (26.0%) received <85 Gy to HR-CTV D90 (P=0.000037; HR, 0.45; 95% CI, 0.29–0.69).
Georg et al. [18] found in a study in MR-based 3D adaptive brachytherapy for cervical carcinoma in 2011 that the overall 5-year actuarial side effect rates were 12.0%, 3.0%, and 23.0% for the rectum, sigmoid, and bladder, respectively. The mean total D2cc was 65±12 Gy for the rectum, 62±12 Gy for the sigmoid colon, and 95±22 Gy for the bladder [18]. In a retrospective audit, Bandyopadhyay et al. [19] reported mean D2cc values for the bladder and rectum were reported to be 83.05 Gy and 76.55 Gy, respectively. Late toxicity (42.0% cases) was observed most commonly in the form of Grade II urinary incontinence (71.42%), Grade II–III rectal toxicity (23.8%), and rectovaginal fistula (4.76%) [19]. In this study, late toxicity was observed in the form of urinary incontinence (56.88%), dysuria (46.21%), edema of the lower abdomen and genital region (68.31%), vaginal stenosis (32.43%), and rectal hemorrhage (8.11%).
Onal et al. [20] concluded that CT-based planning in ICBT is superior to conventional planning in target volume coverage and appropriate evaluation of OARs because the conventional plan overestimates tumor doses and underestimates doses to OARs. Goyal et al. [21] found that point A dose prescriptions do not provide consistent coverage of the HR-CTV, and the difference in coverage increases with increasing CTV for conventional and CT image-based dose prescription approaches. In our study, it was evident that the use of CT image-based treatment planning for ICBT provides the scope to delineate the volumes of the target and OARs, generate DVH data, and optimize doses to each of them, which can prove to be a better surrogate for disease response and toxicity. This study was conducted in the service setting of a peripheral medical college in a developing country, where the majority of the global burden of cervical cancer exists. Given the unavailability of MRI facilities in this region, incorporating CT imaging-based treatment planning for ICBT into routine practice seems promising to reduce this vast disease burden more efficiently with less toxicity to normal tissue. Further studies with longer follow-up periods are needed to generate more robust data to establish the role of CT scans as a valuable imaging tool for 3D image-based treatment in locally advanced cervical carcinoma.
Notes
Conflict of interest
The authors declare no conflicts of interest.
Ethical approval
This study has been initiated after appropriate ethical approval from the Institutional Ethical Committee.
Patient consent
All the cases were enrolled after taking properly informed consent in their own vernacular.
Funding information
This study has no source of funding.
Acknowledgement
I am thankful to my parents, my teachers, my colleagues and my juniors for helping me with this study. Words fail to express my gratitude to Dr. Pratibha Kole, without whom it would not have been possible to bring this study out into reality.