Dietary pattern and risk of endometrioma in Korean women: a case-control study
Article information
Abstract
Objective
The aim of this study was to investigate and compare the dietary patterns of Korean women diagnosed with endometrioma or other benign ovarian cysts.
Methods
A total of 66 patients, comprising 39 patients who were surgically diagnosed with ovarian endometrioma and 27 control patients with other benign ovarian cysts, were included in this case-control study. Trained interviewers identified and interviewed the case patients and controls on the day before the laparoscopic ovarian surgery, using a semiquantitative food frequency questionnaire developed by the Ministry of Health and Welfare of Korea. Statistical analysis was performed using the Wilcoxon sum-rank test for continuous variables and the χ2 test or Fisher’s exact test for categorical variables.
Results
The calcium intake from daily food consumption was significantly lower in patients with endometrioma than in those with other benign ovarian cysts. The dietary intakes of vitamin D, iron, and zinc were also relatively lower in patients with endometrioma than in patients with other benign ovarian cysts, although they did not reach the statistical significance threshold.
Conclusion
The risk of endometrioma is significantly associated with a lower dietary intake of calcium. Future studies including a larger number of patients on a nationwide scale are urgently required for further clarification.
Introduction
Endometriosis is defined as the presence of functioning endometrial glands and stromal cells outside the endometrial cavity, affecting 5–15% of women of child-bearing age, among whom 30–50% develop infertility [1,2]. Many theories have been proposed to explain the pathophysiologic development of endometriosis; however, the etiology of the disease is still unclear [3,4]. Most researchers agree that endometriosis is an estrogen-dependent chronic inflammatory process in the pelvic cavity. Accordingly, endometriosis is associated with pelvic pain and infertility, especially in the case of ovarian endometrioma, which directly affects the ovarian reserve [5].
The major risk factors based on such estrogen-dependent features of endometriosis include increased estrogen exposure frequently leading to early menarche, prolonged duration of menstrual flow, shorter menstrual cycle interval, and nulliparity [1,6,7]. One of the factors that could influence physiologic estrogen activity and exposure is the dietary pattern of a patient, which is a valuable, modifiable factor not only for disease management but also for prevention when well understood [1,8]. A number of studies have been published, although they reported rather inconclusive data. Some studies have reported that a plant-based and high-fiber diet increases estrogen excretion and decreases the concentration of bioavailable estrogen. However, the effects of vegetable consumption on the risk of ovarian endometrioma are unknown [1,9–11]. Moreover, studies investigating the association between red meat consumption and the risk of endometrioma development have reported contradictory results [12].
When evaluating the relationship between certain diets and diseases, it is important to note that the effect of diet on the hormone levels or inflammatory status of the body could be influenced by the cooking method, storage techniques, and/or management of food resources (e.g., use of pesticides) [13]. Because of such variables, the precise evaluation of the relationship between dietary patterns and the occurrence of a specific disease requires statistical analysis based on a homogeneous population with a shared culinary culture. Thus, this case-control study investigated the dietary patterns of Korean women diagnosed with ovarian endometrioma (histologically confirmed after laparoscopic surgery) compared with patients with other benign ovarian cysts with surgical and histologic confirmation.
Materials and methods
1. Study population
The current case-control study included a total of 66 patients referred to a single, tertiary, national university hospital from September 2018 to August 2019. Of these, 39 patients diagnosed with unilateral or bilateral ovarian endometrioma were assigned as the case group. Another 27 patients with other benign ovarian cysts, such as teratomas or cystadenomas, were selected as the control group. The other benign ovarian cysts were not further distinguished because they were less likely to be associated with estrogen exposure [14]. All patients underwent routine preoperative examinations and medical history taking for laparoscopic surgery, after which the ovarian pathology was diagnosed with histologic confirmation. In the review of the patients’ medical records, menstrual irregularity was defined as a menstrual cycle length of less than 21 days and/or more than 35 days with varying intervals, and history of smoking included both present and previous smoking. For the case group, only patients who were diagnosed with endometrioma for the first time were included; those with recurring endometrioma were excluded. Patients who had been previously requested to restrict food intake because of their medical history, such as diabetes, were also excluded, as were women who had been taking hormonal contraceptives for contraception or dysmenorrhea treatment. The control group was composed of patients with surgically and histologically confirmed ovarian teratomas or serous or mucinous cystadenomas. Patients who were diagnosed with coexisting endometriosis during the operation were excluded from the control group, as were those who had been preoperatively diagnosed with comorbid myoma uteri and/or adenomyosis with imaging modalities such as computed tomography or magnetic resonance imaging.
2. Dietary assessment
Food intake data were collected using a validated semiquantitative food frequency questionnaire (SQFFQ) about the patients’ dietary patterns for the previous year. The SQFFQ, which covered 112 food groups derived from the Korean National Health and Nutrition Examination Survey, was developed by the Ministry of Health and Welfare [15]. Food intake frequency was divided into the following 9 categories for all 112 items: never or seldom, once per month, 2 to 3 times per month, once or twice per week, 3 to 4 times per week, 5 to 6 times per week, once per day, twice per day, and 3 or more times per day. The participants indicated the frequency of intake of each food item based on the provided definitions of portion sizes. The respondents indicated whether the amount of food they consumed in 1 sitting was more than, equal to, or less than 1 portion, based on pictures of the food items. Daily intake was calculated using the midpoint of the assigned frequencies of each category for each food item. Food intake was calculated by multiplying the midpoints of the frequencies for each food category by the number of times each food item was consumed. By using the SQFFQ food intake data, the consumption of energy and nutrients, such as protein, carbohydrates, fat, fiber, total vitamin A, vitamin B1, vitamin C, calcium, and iron, was calculated using Can-Pro 2.0 software (The Korean Nutrition Society, Seoul, Korea) [16]. Trained interviewers identified and supervised the patients throughout the completion of the questionnaire. All interviews were conducted in a hospital setting.
3. Statistical analysis
Statistical analyses were performed using SAS software (version 9.4; SAS Institute, Cary, NC, USA). The frequency distributions of categorical demographic and personal behavior-related variables were obtained according to the presence of endometrioma or other benign ovarian cysts, and statistical significance was determined using the χ2 test. The median and interquartile range (IQR) of the dietary intake of each nutrient, as determined using the SQFFQ method, were calculated. Statistical significance was determined using the Wilcoxon rank-sum test for continuous variables.
Results
1. Patient characteristics of the endometrioma and other benign cyst groups
The background characteristics of the patients are presented in Table 1. No statistical differences were found in the patients’ age, body mass index, age at menarche, and parity between the groups. The median serum level of carbohydrate antigen 125 in the endometrioma group was 34.80 U/ mL that in the benign ovarian cyst group was 18.20 U/mL. None of the patients in either group had a history of diabetes, hypertension, or dyslipidemia.

Patient characteristics in the endometrioma group and the other benign ovarian cyst group
2. Results of semiquantitative food frequency questionnaire in the endometrioma and other benign cyst groups
Table 2 shows the results of the SQFFQ in both groups. The dietary calcium intake was significantly lower in the endometrioma group than in the other benign ovarian cyst group, with median (IQR) values of 530.83 (406.89–725.23) mg and 779.40 (518.52–867.18) mg, respectively (P=0.047). Vitamin D, iron, and zinc intakes were also relatively lower in the endometrioma group than in the other benign cyst group, but without statistically significant differences. No other statistically significant difference was observed in the rest of the evaluated nutrients: carbohydrates, lipids, proteins (both plant-based and animal-based), dietary fibers (both soluble and insoluble), vitamins, minerals (including phosphorus, sodium, chlorine, potassium, and magnesium), cholesterol, total fatty acids, saturated fatty acids, unsaturated fatty acids, other fatty acids (including caproic acid, caprylic acid, and palmitic acid), and amino acids (including isoleucine, cysteine, phenylalanine, and aspartate).
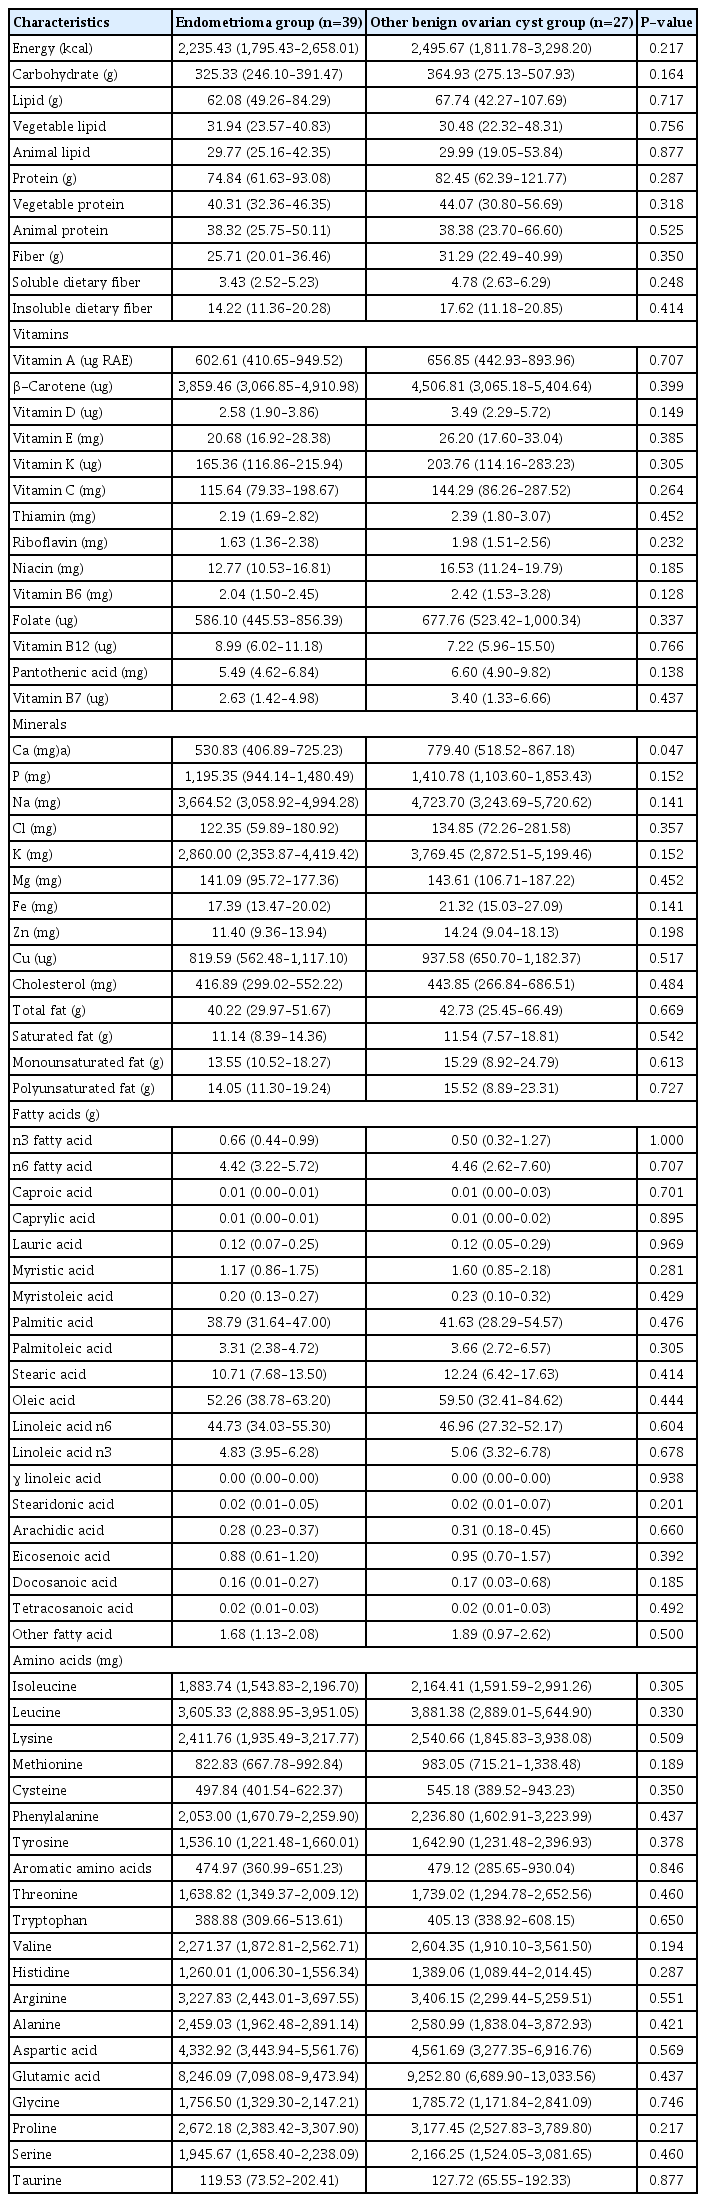
Dietary intake of each nutrient in the endometrioma group and the other benign ovarian cyst group
Discussion
In this study of a homogeneous population of Korean women living in a local city with a shared culinary culture, the dietary intake of calcium was significantly lower in the endometrioma group. Moreover, although statistical significance was not reached, the dietary intakes of vitamin D, iron, and zinc were relatively lower in the endometrioma group than in the control group. Our data did not provide supporting evidence for a relationship between endometriosis and any of the other nutrients or food groups examined, except for calcium, vitamin D, iron, and zinc.
The lower intakes of calcium in our patients with endometrioma are partially consistent with previously reported data from different ethnicities and population pools. Harris et al. [17] reported that calcium, vitamin D, and magnesium intakes from food sources were inversely related to endometriosis. In their study, participants with a higher quintile intake of calcium from food sources had a lower risk of endometriosis, with a trend of statistical significance. Moreover, Trabert et al. [1] suggested inverse associations between endometriosis and dairy product intake or calcium intake from food sources, although the difference was not statistically significant (odds ratio, 0.7; 95% confidence interval, 0.4–1.2). The authors suggested the ability of calcium and vitamin D to downregulate growth-promoting factors, such as insulin-like growth factor-I, and to upregulate negative growth factor regulators, such as transforming growth factor β. Further-more, according to their study, dietary factors such as dairy products and several specific nutrients may be related to the physiologic processes associated with endometriosis through their effects on systemic inflammation. The association between vitamin D and endometrioma seems more complicated to analyze than the association of other nutrients with endometrioma. As mentioned earlier, the dietary intake of vitamin D was inversely related to endometriosis, although only a small proportion of vitamin D is obtained from dietary sources [17]. Nevertheless Ciavattini et al. [18] also reported that a relatively high proportion of women with ovarian endometrioma showed hypovitaminosis D. Similarly, Abbas et al. [19] observed that vitamin D treatment induced a reduction in the endometriosis cyst dimension in a rat model. To clarify the role of vitamin D in endometriosis, further studies are urgently required.
In our study, the dietary intake of zinc was also lower in the endometrioma group (median [IQR] = 11.40 [9.36–13.94] mg in the case group and 14.24 [9.04–18.13] mg in the control group, P=0.198). Similar patterns were observed in the study by Messalli et al. [20], who reported that patients with endometriosis presented a lower serum zinc concentration than the control group (1,010±59.24 μg/L vs. 1,294±62.22 μg/L, P<0.05). They also suggested that zinc interferes in the pathogenic processes of endometriosis, such as inflammation and immunity.
Other important dietary factors known to be related to the risk of endometriosis development are red meat, trans fats, and omega-3 fatty acids. Large studies have been conducted to reveal such relationships, and their results have shown that increased intakes of red meat and trans fats, and decreased intake of omega-3 fatty acids were related to an increased risk of endometriosis [2,8,21]. In our study, the intake of animal fat and protein showed no difference between the 2 groups. Such results may be due to the small number of patients included in this study; however, they could also result from the inclusion in the current study of an East Asian population with eating habits that differ from those of Western populations analyzed in previous studies. Traditionally, Asian populations are known to consume lower amounts of meat than their Western counterparts. Although the general dietary patterns have been showing similarities worldwide, owing to the increasing cultural exchanges and the faster and easier internal trades of food products, the daily eating habits still considerably differ across different countries [22,23]. Thus, the red meat consumption in our Korean population may have been too low to present any significant effect on the risk of endometriosis, compared with previous data from Western populations. Moreover, the current study was conducted in a local port city in South Korea, where the population had easy and frequent access to fish products containing omega-3 fatty acids. Accordingly, both the case and control groups had been exposed to and consumed higher levels of omega-3 fatty acids than the general population, which could have affected the results of the current study.
The current study had several limitations. As this was a retrospective study that reviewed previously obtained medical records, the baseline characteristics of the patients were limited to 9 categories for the risk factors of endometrioma. Although such categories included major risk factors, more detailed features of the patients still need to be investigated in future studies. In addition, most studies evaluating population dietary patterns in association with endometriosis use self-questionnaires; thus, some of the data are vulnerable to recall bias. However, in our study, all questionnaires were completed by medical professionals who had been educated about the purpose and outline of the study. In addition, in epidemiologic studies, the diagnosis or exclusion of endometriosis is typically determined solely by evaluating the patients’ medical records. In our study, all patients were diagnosed with or ruled out from having endometriosis by laparoscopic surgery and histologic confirmation, thus obtaining a more precise medical status for each patient.
Other limitations include the potentially compromised effects of a single nutrient according to the cooking method, even with the same amount of ingredients. Such variations are difficult to standardize in epidemiologic studies. However, it may be important to implement in certain areas in persons with similar lifestyles, and our study included a homogeneous population of only Korean women and local area residents.
Finally, the number of patients included in the present study was relatively small. To offset the size limitation, all patients included in the study were surgically diagnosed with the ovarian pathology (endometrioma or a benign ovarian cyst), with histologic confirmation, and every food frequency questionnaire interview was supervised by a medical professional. Additionally, to our knowledge, this is the first study to analyze the effect of dietary patterns on the risk of endometriosis in a Korean population.
In summary, the risk of endometriosis is significantly associated with a lower intake of calcium, and despite being statistically insignificant, lower intakes of vitamin D, magnesium, and zinc were observed in patients with ovarian endometrioma. Further studies including a larger number of patients on a nationwide scale with detailed statistical analysis of significant nutrients are urgently required to determine the link between dietary patterns and the risk of endometriosis, to enable the establishment of patient education programs and lifestyle consultation on population-based strategies for preventing the disease.
Notes
Conflict of interest
No potential conflict of interest relevant to this article was reported.
Ethical approval
The current study was officially exempted from ethical approval by the institutional review board of the Human Research Protection Committee of Pusan National University Hospital (committee reference No. 1912-014-086).
Patient consent
All patients provided informed consent to the use of their medical records and completed questionnaires for research purposes.
Funding information
None.