A personalized nomogram for predicting 3-year overall survival of patients with uterine carcinosarcoma in a tertiary care hospital in Southern Thailand
Article information

Abstract
Objective
To develop a nomogram for predicting 3-year overall survival (OS) and outcomes of surgically staged patients with uterine carcinosarcomas (UCS).
Methods
This retrospective study analyzed the clinicopathological characteristics, treatment data, and oncological outcomes of 69 patients diagnosed with UCS between January 2002 and September 2018. Significant prognostic factors for OS were identified and integrated to develop a nomogram. Concordance probability (CP) was used as a precision measure. The model was internally validated using bootstrapping samples to correct overfitting.
Results
The median follow-up time was 19.4 months (range, 0.77–106.13 months). The 3-year OS was 41.8% (95% confidence interval [CI], 29.9–58.3%). The International Federation of Gynecology and Obstetrics (FIGO) stage and adjuvant chemotherapy were independent factors for OS. The CP of the nomogram integrating with body mass index (BMI), FIGO stage, and adjuvant chemotherapy was 0.72 (95% CI, 0.70–0.75). In addition, the calibration curves for the probability of 3-year OS demonstrated good agreement between the nomogram-predicted and observed data.
Conclusion
The established nomogram using BMI, FIGO stage, and adjuvant chemotherapy accurately predicted the 3-year OS of patients with UCS. The nomogram was useful for patient counselling and deciding on follow-up strategies.
Introduction
Uterine carcinosarcomas (UCS), previously known as malignant mixed müllerian tumors (MMMT), are rare, aggressive neoplasms, representing 2–5% of all uterine tumors. UCS are biphasic tumors composed of both malignant epithelial and mesenchymal tissue elements [1]. Recent evidence has demonstrated that UCS are carcinomas with sarcomatous metaplasia, where the carcinomatous component is the impulsion of the disease, and the sarcomatous component is derived from dedifferentiation of the carcinomatous component. Similar to uterine carcinoma, histological data have shown that lymphatic metastasis is an important mechanism in the spread of cancer, with the carcinomatous component, and rarely the sarcomatous part, predominantly responsible for most metastases [2]. Consequently, these tumors have changed from uterine sarcomas to uterine carcinomas, reflecting the postulation that they were primarily epithelial tumors that developed a mesenchymal component.
The staging system and histological classifications were recently based on the criteria established by the revised International Federation of Gynecology and Obstetrics (FIGO) 2009 staging system and the 2014 World Health Organization (WHO) classification of tumors [2,3]. Widely accepted treatments include surgical staging and adjuvant chemotherapy; in contrast with the adjuvant radiotherapy, which remains controversial [4–6]. The survival outcome of UCS is unfavorable, contributing to a poor 5-year overall survival (OS) rate of 18–39% in advanced stages [1]. UCS are likely to present with extrauterine disease in 60% of cases, and multiple studies have reported that disease stage is the most important prognostic factor in UCS [6–8]. Other prognostic factors associated with unfavorable outcomes include deep myometrial invasion (MI), lymphovascular space involvement (LVSI), histology of the carcinomatous component, extent of the sarcomatous component, and presence of heterologous elements [9].
Currently, FIGO staging is used to classify cancer prognosis, which is inaccurate. A nomogram is a graphical illustration of a mathematical model that includes predictors of an endpoint. Nomograms have been widely used for cancer prognosis, including uterine cancers, to anticipate reliable prognostic information for individual patients [10–14]. Nonetheless, nomograms for predicting the outcomes of survival endpoints after primary treatment for UCS are scarce. Therefore, the purpose of the present study was to develop a nomogram prognostic model that accurately predicts the 3-year OS of patients with UCS, and to retrospectively evaluate the clinicopathological characteristics and oncological outcomes of these patients. We expect that this nomogram will provide a more individualized and accurate estimation of the OS after primary therapy.
Materials and methods
1. Patient cohort
After obtaining approval from the Ethics Committee for Research Involving Human Subjects of the Prince of Songkla University Faculty of Medicine (REC 61-320-12-3), a data search was performed for all patients diagnosed with UCS between January 2002 and September 2018. We included patients at all stages, from those who underwent definitive surgical staging to hysterectomy, bilateral salpingo-oophorectomy, peritoneal washings, pelvic and para-aortic lymphadenectomy in which the removal of 10 or more lymph nodes was considered optimal [15], and omental biopsy with or without adjuvant therapy. Patients with coexisting cancer were excluded. The follow-up protocol at our institute was every 3 months in the first 2 years, every 6 months in the third to 5 years, and annually thereafter.
Data extracted from electronic databases for analysis included age at diagnosis, body mass index (BMI), menopausal status, medical disease (diabetes mellitus, hypertension, and/or dyslipidemia), clinical symptoms, FIGO stage, tumor size, MI, LVSI, lower uterine segment involvement, cervical involvement, uterine serosal or ovarian involvement, omental involvement, positive peritoneal cytology, residual tumor, lymph node metastasis, lymph node count, adjuvant radiotherapy, adjuvant chemotherapy, and disease recurrence or progression. Clinical stage and histological classification were based on the criteria established by the revised FIGO 2009 and 2014 WHO classification of tumors.
Survival outcomes were OS and progression-free survival (PFS). OS was defined as the time from surgery to death, regardless of the cause or date of the last follow-up, for patients who were alive and censored. PFS was defined as the time from surgery to disease progression or recurrent disease.
2. Statistical analysis
Patient demographics and clinicopathologic characteristics are presented as descriptive data. OS and PFS probabilities were estimated using the Kaplan-Meier method. Univariate and multivariate analyses were performed using the Cox proportion hazards model. Hazard ratios (HR) were estimated with a 95% confidence interval (CI), and probability values of <0.05 were considered statistically significant. To permit nonlinear relationships, continuous variables were modelled using restricted cubic splines. Collinearity was also assessed.
A nomogram was used to predict the 3-year OS probability of patients with UCS. The 3-year predicted survival probability was calculated for each patient using a Cox regression model. The nomogram was constructed based on the results of multivariate Cox regression analysis. Discrimination between patients who had an event and those who did not was estimated by the area under the curve of a receiver operating curve, which was the concordance probability (CP) in the nomogram that reflects the accuracy of the prognostic model [16,17]. Two hundred bootstrap resamples were applied to validate the accuracy estimates and reduce the overfit bias from the model derived from the original sample.
Calibration was determined by dividing the patients based on their nomogram-predicted probabilities and assessed via a calibration plot by plotting the nomogram’s predicted 3-year OS probability against the patient’s observed or actual probability, as calculated using the Kaplan-Meier method. Validation with 200 bootstrap resamples was used to analyze the model activity. Statistical analysis was conducted using the rms package of R software (version 3.5.3; R Foundation for Statistical Computing, Vienna, Austria).
Results
In total, 81 patients with UCS were identified; of these, only 69 patients who underwent definite surgical staging were enrolled. The mean age was 63.4 years (range, 40–90), and the median BMI was 25.5 kg/m2 (range, 21.3–30.2). Patient demographics and clinical characteristics are presented in Tables 1 and 2, respectively. The median follow-up period for the surviving patients was 19.4 months (range, 0.77–106.13). Of the 69 patients, 35 (50.72%) developed recurrent or progressive disease and 34 (49.28%) died. The median PFS was 20.7 months, and the longest time to progression was 26 months. The median OS was 31 months, with a 3-year OS rate of 41.8% (95% CI, 29.9–58.3%).
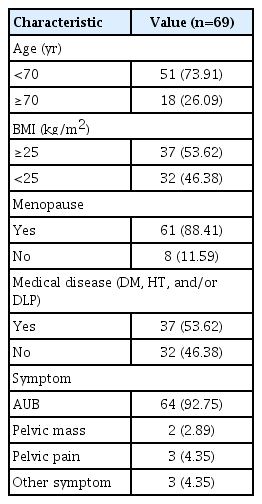
Demographics and clinicopathologic characteristics of patients with uterine carcinosarcomas
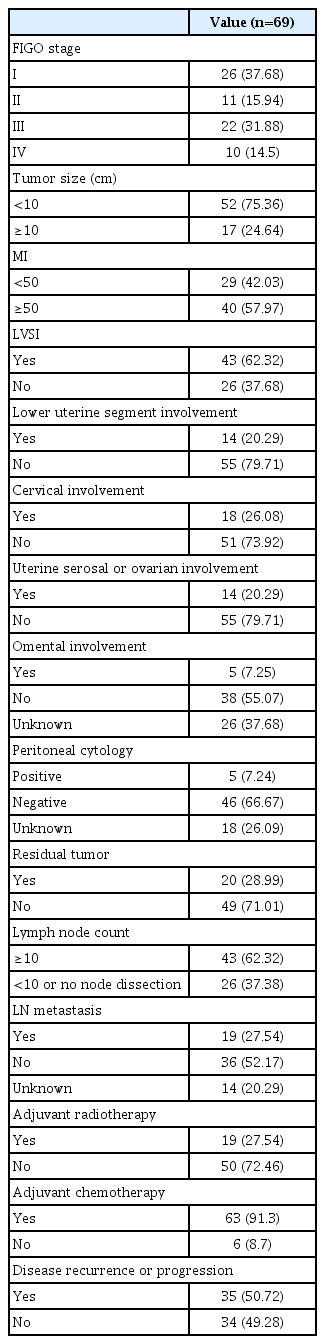
Clinicopathologic characteristics and treatment of patients with uterine carcinosarcomas
Univariate analysis was performed to identify prognostic variables for oncological outcomes, as shown in Table 3. Further multivariate analysis found that FIGO stage (HR, 2.80; 95% CI, 1.41–5.55; P=0.003) and peritoneal cytology positivity (HR, 4.70; 95% CI, 1.42–15.59; P=0.011) were independent adverse prognostic factors for PFS (Table 4). The significant independent factors for OS were FIGO stage III (HR, 2.33; 95% CI, 1.03–5.27; P=0.042), FIGO stage IV (HR, 5.91; 95% CI, 2.35–14.86; P<0.001), and adjuvant chemotherapy (HR, 0.24; 95% CI, 0.09–0.65; P=0.005) (Table 5).
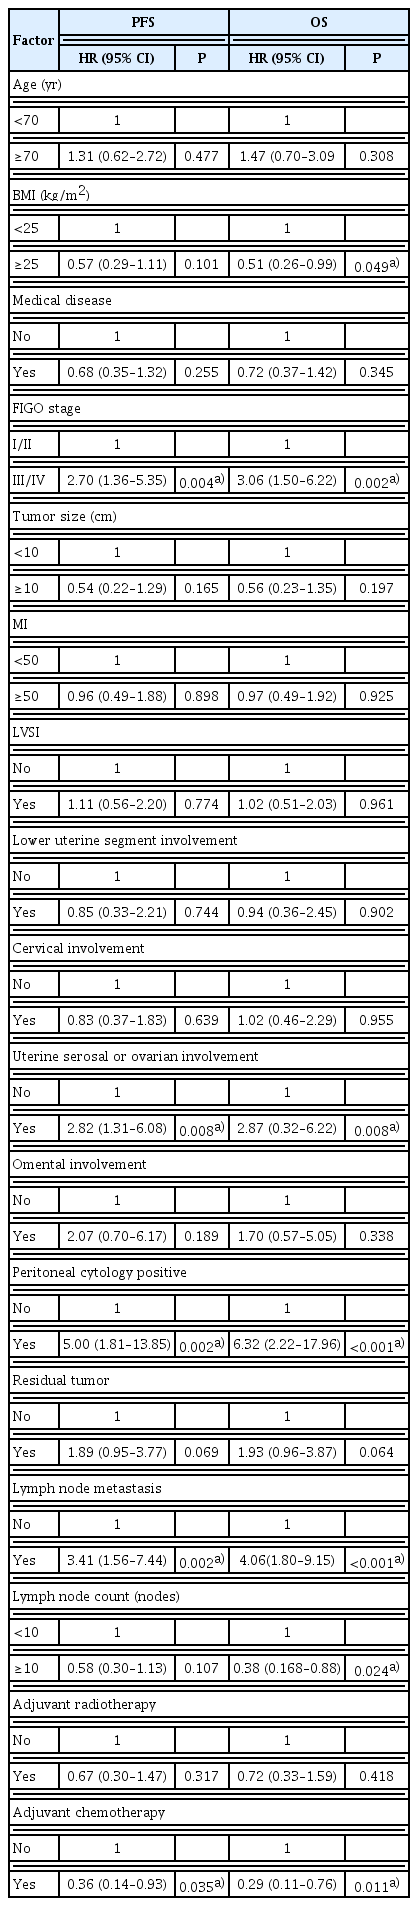
Univariate analysis for the correlation of clinicopathologic and treatment parameters with PFS and OS
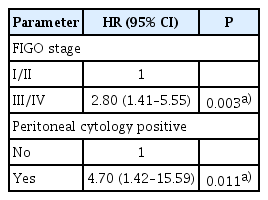
Multivariate analysis for the correlation of clinicopathologic and treatment parameters with PFS

Multivariate analysis for the correlation of clinicopathologic and treatment parameters with OS
The variables were screened based on clinical evidence obtained from univariate and multivariate analyses before initiating the model, as previously suggested in the literature. No more than three prognostic variables should be incorporated into the model, as recommended by Harrell’s guideline [11]. Subsequently, the best-fit final regression model was chosen based on the clinical and statistical significance of the predictors from the univariate and multivariate analyses. Finally, an optimal prognostic nomogram for predicting the 3-year OS using BMI, FIGO stage, and adjuvant chemotherapy was developed (Fig. 1). The CP of the nomogram was 0.72 (95% CI, 0.70–0.75). The nomogram suggested that FIGO staging had the largest contribution to prognosis, followed by adjuvant chemotherapy and BMI. The nomogram was internally validated for the probability of 3-year OS using a calibration plot, suggesting an agreement between the nomogram predictions and observations, with a mean absolute error of 0.023 (Fig. 2).
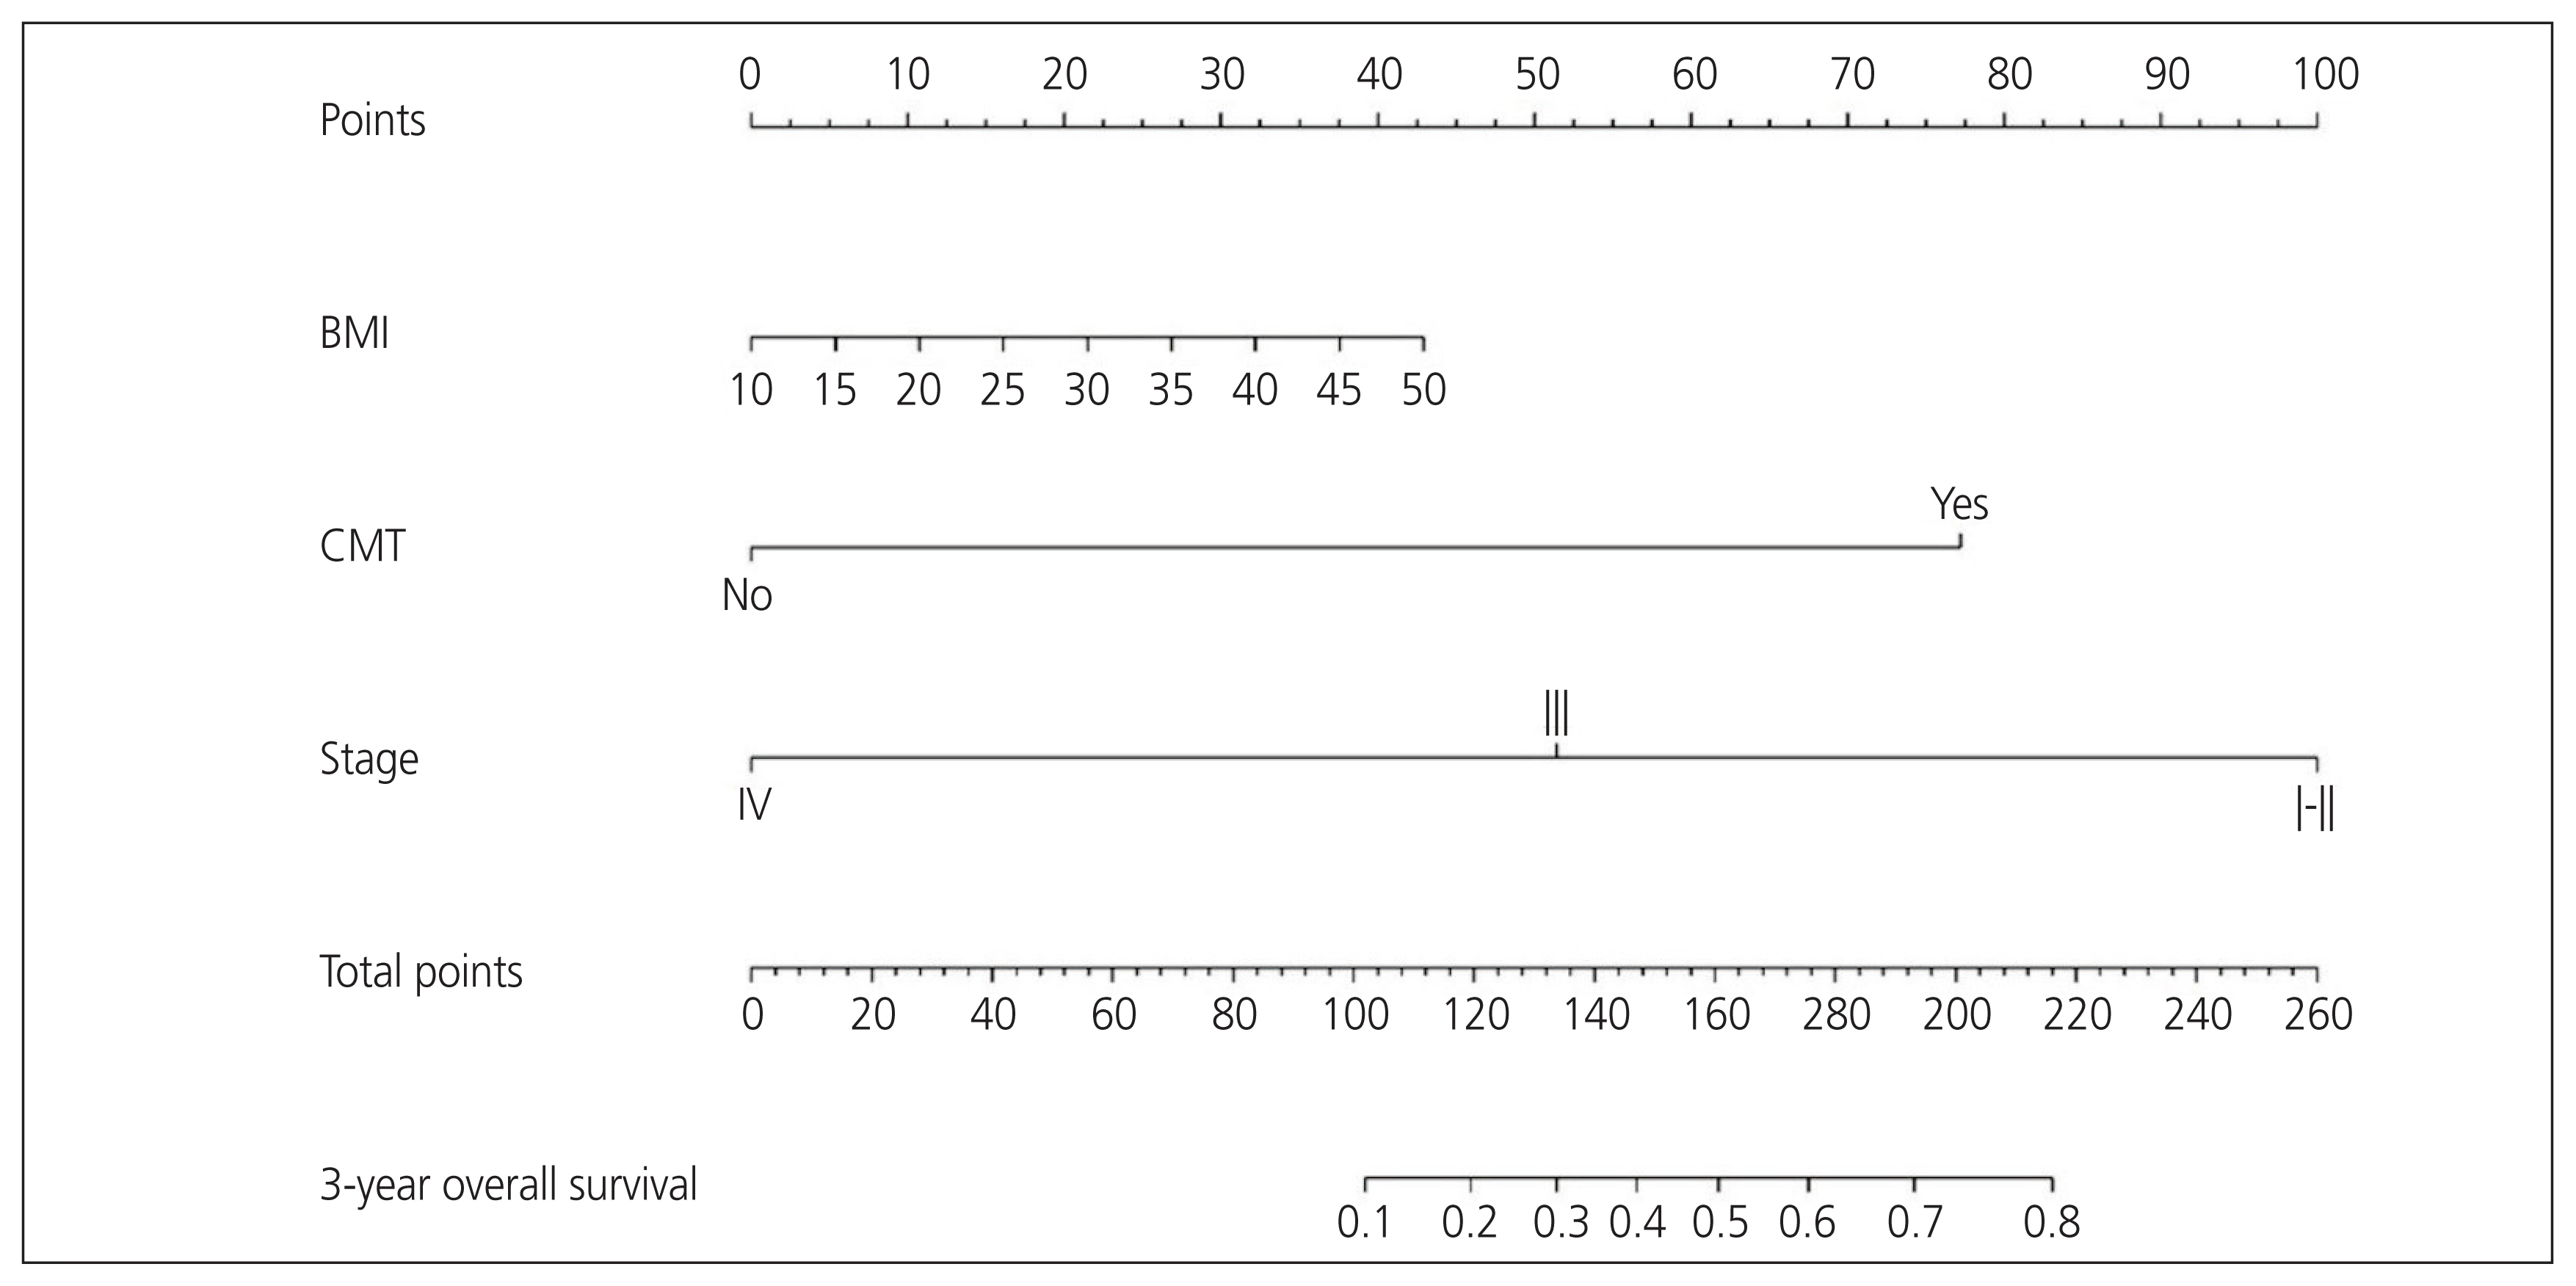
Nomogram for predicting 3-year overall survival. BMI, body mass index; CMT, adjuvant chemotherapy.
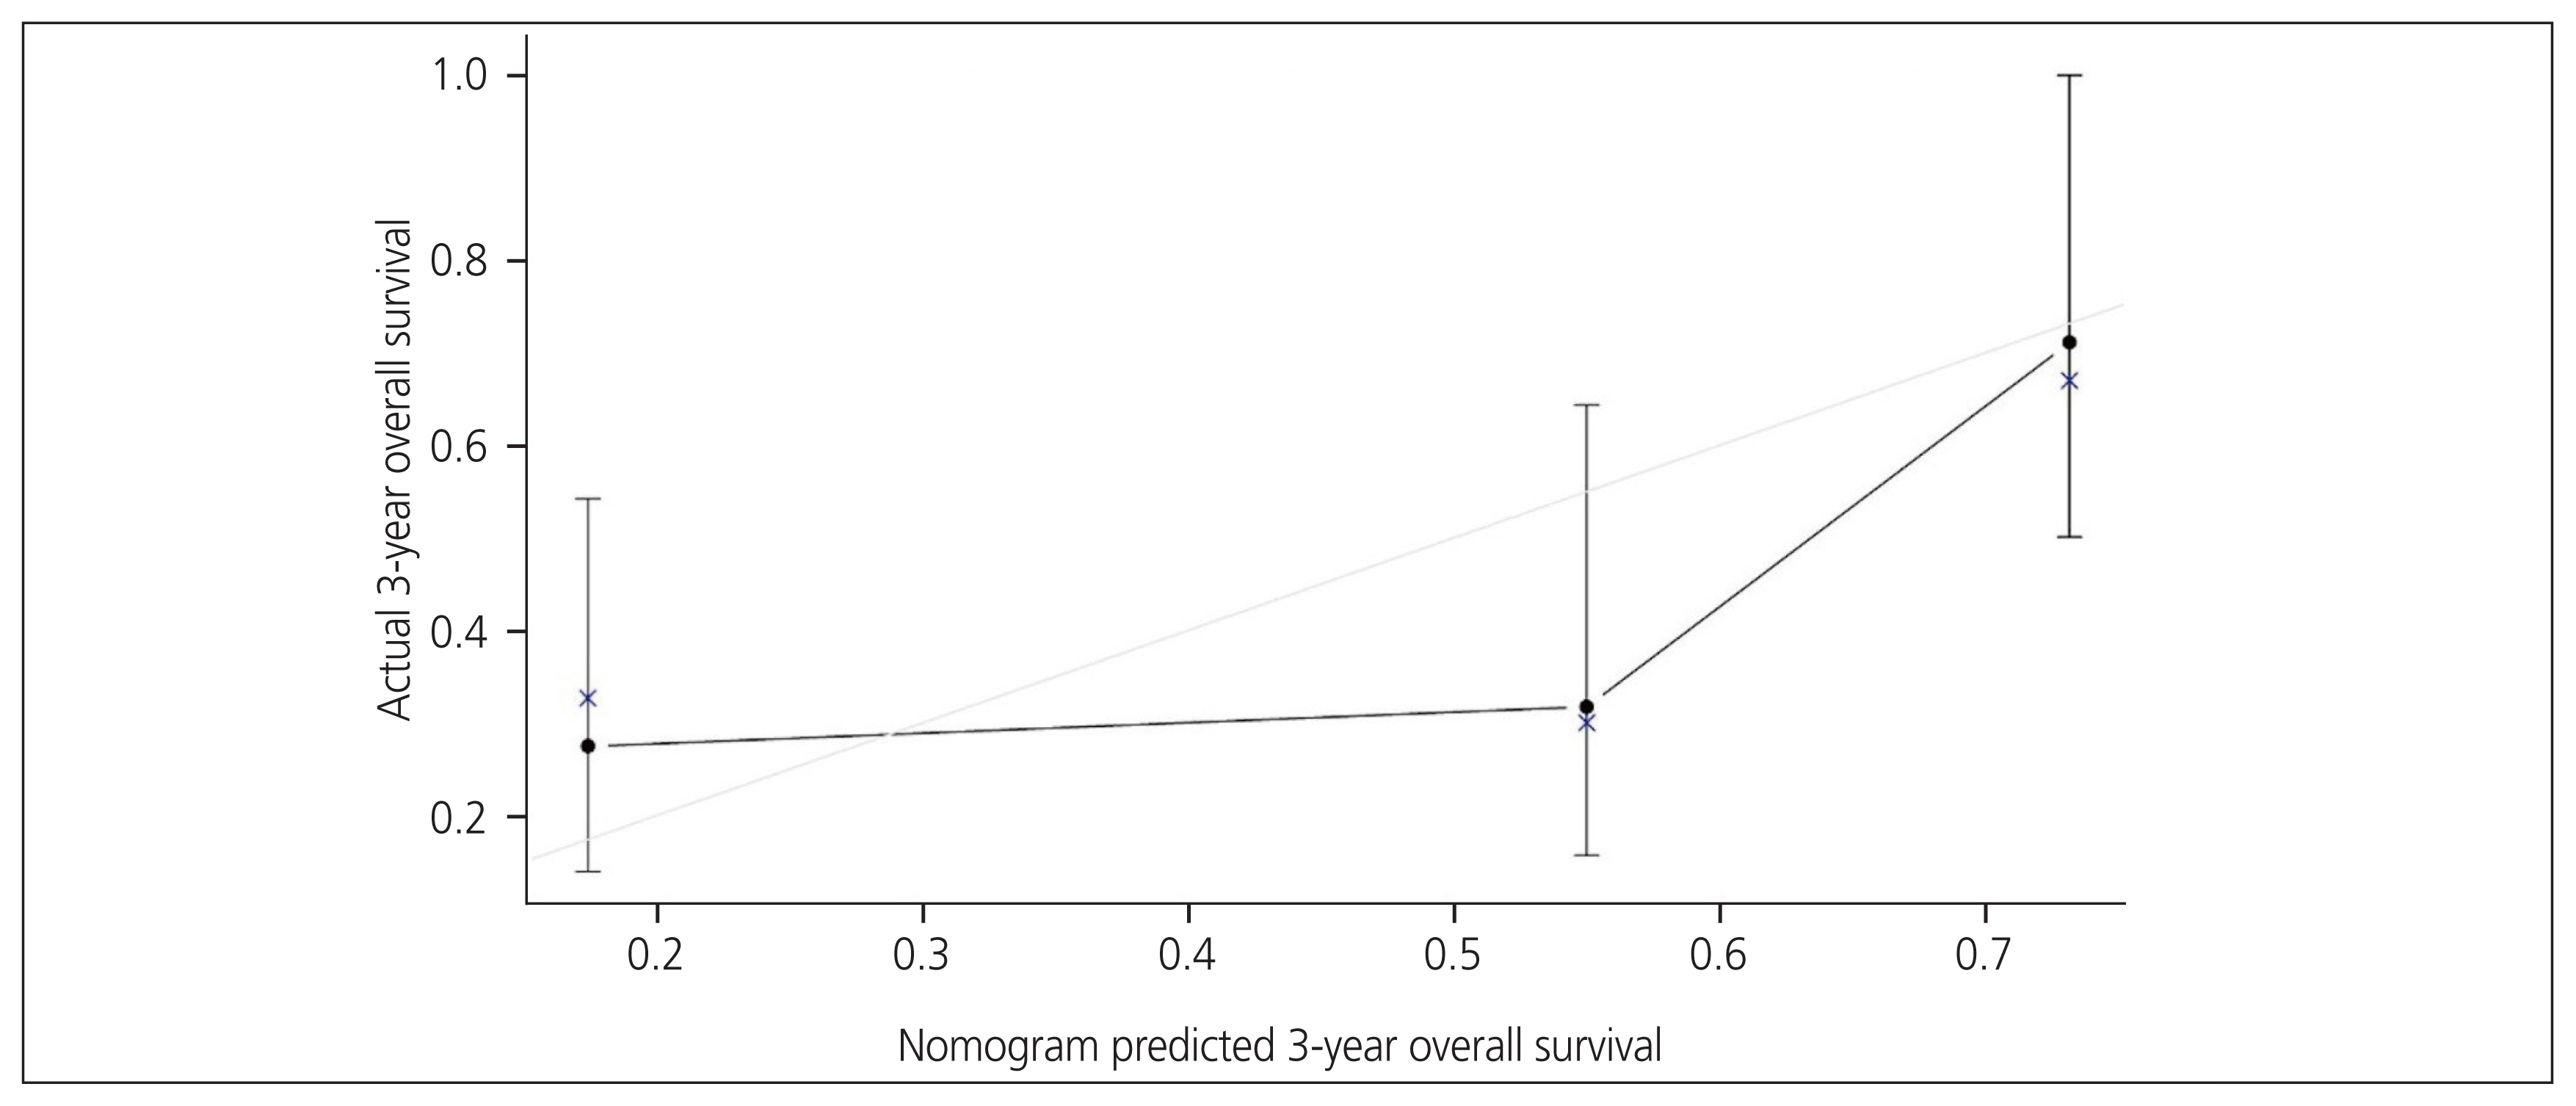
Calibration curves of the nomogram. Solid line represents the actual nomogram; gray line represents the ideal agreement between the actual and predicted probabilities of 3-year overall survival; vertical bars represent 95% confidence interval; dots correspond to apparent predictive accuracy; and crosses mark the bootstrap-corrected estimates.
For each patient, points were assigned to each of the three variables, and the total score was calculated using the nomogram. The total number of points corresponded to the predicted 3-year OS probabilities. It is important to note that all three variables must be available to use the nomogram. As an example of the clinical utility of the nomogram, a patient with a BMI of 30 kg/m2 (21.25 points) who had received adjuvant chemotherapy (77.5 points) and with FIGO stage III (51.25 points) would have an estimated 3-year OS of approximately 42.5%.
Discussion
Predictive accuracy of OS after cancer treatment is beneficial for patient counselling and decision-making during follow-up. Previous reports of survival in UCS cases were mostly based on disease stage [7,18–20]. Additional equipment for prognosis prediction could adjunct disease stage, which is usually used as a survival predictor. Therefore, it is critical to develop a survival prediction nomogram that provides a precise level of survival prediction for surgically staged UCS. In this retrospective study, we investigated the clinicopathological characteristics and prognosis of 69 surgically treated patients with UCS at a tertiary care hospital in southern Thailand. According to the univariate and subsequent multivariate analyses, FIGO stage and peritoneal cytology positivity were independent prognostic factors for PFS, whereas FIGO stage and adjuvant chemotherapy were significant prognostic factors for OS. We established a 3-year OS predicting nomogram using BMI, adjuvant chemotherapy, and FIGO stage, which offers an accurate prediction of UCS and allows a superior individualized prediction of 3-year OS. The CP of our nomogram for predicting 3-year OS was 0.72 (95% CI, 0.70–0.75), with an accurate calibration and good discriminative capacity (mean absolute error=0.023).
The univariate analysis indicated that higher BMI in patients with UCS was associated with better OS than lower BMI. However, in the multivariate analysis, higher BMI was not a significant prognostic factor for OS. Obesity is associated with the excessive production of steroid hormones, which increases the incidence of endometrial cancer and poor prognosis [21,22]. Many studies have found that higher BMI is associated with a favorable prognostic factor in many tumor types [23]. Van and Arends [24] found that obese patients have better nutritional resources to confront problems associated with advanced cancer and tumor cachexia, and early dietary supplementation has a favorable influence on cancer survival. According to Münstedt et al. [23], obese patients with uterine cancer do not appear to have poorer outcomes than their nonobese counterparts, and lean patients with advanced or recurrent gynecological cancers should be advised to gain some weight to improve their chances of survival. However, patients with favorable prognosis are advised to normalize their weight to avoid the common negative outcomes of obesity.
Postoperative adjuvant therapy should be considered for all stages of UCS. However, in patients with early stage I–II UCS, the recommendation for adjuvant chemotherapy is based only on limited data obtained from retrospective studies [8,25]. Contrastingly, adjuvant chemotherapy is strongly recommended for patients with advanced-stage disease. Systematic reviews by Galaal et al. [4] found that patients with stage III–IV and persistent or recurrent UCS who have received combination chemotherapy had a lower risk of death and disease progression, on the other hand, radiotherapy was not associated with improved survival.
The present study also showed worse prognosis among patients with advanced-stage disease. The extent of the tumor beyond the uterus at the time of diagnosis is the most important unfavorable prognostic factor. Multiple studies have reported that disease stage is the most important predictor of survival in UCS [6,7]. We compared stage I–II with divided stage III–IV in the multivariate analysis because, in UCS, disease extending beyond the uterus has remarkably decreased survival. Gonzalez Bosquet et al. [18] demonstrated that the 5-year disease-specific survival rates for stages I–II, III, and IV were 59%, 22%, and 9%, respectively. Abdulfatah et al. [7] enrolled 196 patients with UCS to identify potential prognostic factors and found that patients with FIGO stage III–IV had an extremely unfavorable disease-free interval compared to those with FIGO stage I–II (HR, 2.47; 95% CI, 1.53–3.99; P=0.001). Chen et al. [19] evaluated the correlation between clinical, histopathologic, and immunohistochemical characteristics staining for p16, p53, and PAX8 in UCS and found no significant correlations between the immunohistochemical staining patterns and clinicopathologic and survival, although FIGO stage III–IV was associated with poor relapse-free survival (HR, 4.42; 95% CI, 1.76–11.10; P=0.002) and OS (HR, 3.38; 95% CI, 1.22–9.32; P=0.019) compared with stage I–II disease. In addition, Harano et al. [20] found that patients with UCS stage III–IV were significantly associated with worse disease-free interval (HR, 2.41; 95% CI, 1.68–3.46; P<0.0001) and shorter median OS (HR, 1.94; 95% CI, 1.25–3.03; P=0.0034) as compared to those with stage I–II disease.
There is a limited number of nomogram studies to predict the prognosis of patients with UCS. Abu-Rustum et al. [13] constructed a nomogram predicting the 3-year OS of 1,735 patients with endometrial cancer after primary treatment, including five variables: age at diagnosis, number of negative lymph nodes, stage, final tumor grade, and histologic subtype. The histological subtypes consisted of adenocarcinoma, MMMT, and clear cell/papillary serous carcinoma. The CP estimator for the nomogram was 0.746±0.011. However, in this study, only patients with UCS with different covariates in the nomogram based on data from patients who were more representative of our population and institution were evaluated.
This study has some limitations. First is its retrospective nature. Data were collected over several years from a single institution. Due to the rarity of the disease, the number of patients included in the study was relatively small compared to that in the study conducted by Abu-Rustum et al. [13], who evaluated the survival-predicting nomogram model for endometrial cancer, including UCS cell type. We created this nomogram without external validation, which, in the future, may provide tumor biological data that could affect disease prognosis. Therefore, further research evaluating the prognostic significance of our nomogram in other populations, larger cohorts, longer follow-up times, and new molecular knowledge are warranted.
In conclusion, three variables, namely BMI, FIGO stage, and adjuvant chemotherapy, were identified for the construction of a nomogram to predict the 3-year OS of patients with UCS. This model could assist clinicians in making more individualized and specific predictions of patient prognosis. In addition, the nomogram could be beneficial for patient counselling and deciding on follow-up strategies.
Notes
Conflict of interest
No conflict of interests relevant to this article were reported.
Ethical approval
This study was approved by the Ethics Committee for Research Involving Human Subjects of the Prince of Songkla University Faculty of Medicine (REC 61-320-12-3).
Patient consent
The requirement for informed consent was waived due to the retrospective study and full anonymity of the participants was maintained.
Funding information
This research was supported by the Faculty of Medicine, Prince of Songkla University and Ms. Jirawan Jayuphan, Internal Affairs Unit, Faculty of Medicine, Prince of Songkla University.